
CONTINUOUS GYPSUM PLANT MONITORING

Table of Contents
GYPSUM WALLBOARD MANUFACTURING
Gypsum plant monitoring has traditionally meant periodic testing tied to regulatory schedules. In practice, wallboard manufacturing runs as a continuous, high-volume process, and dust, moisture and combustion byproducts are a normal part of daily operation. This white paper looks at a different approach: treating continuous dust, emissions and process sensing as operating information for the whole plant.
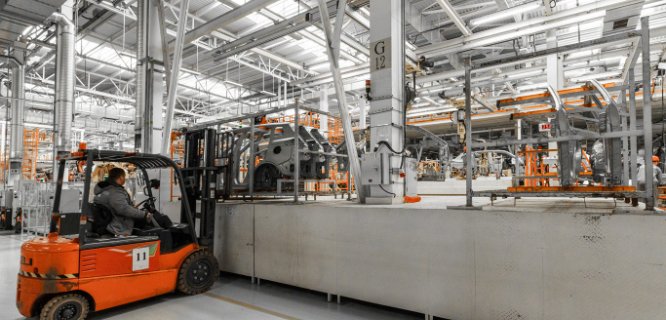
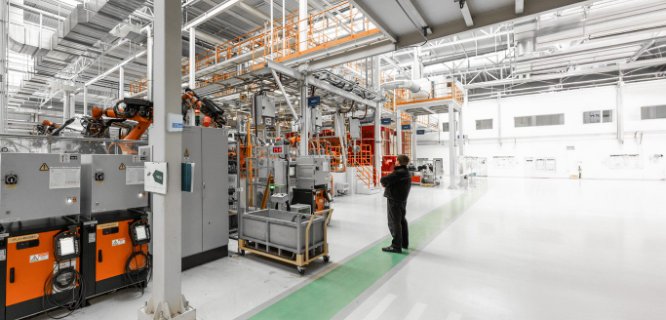
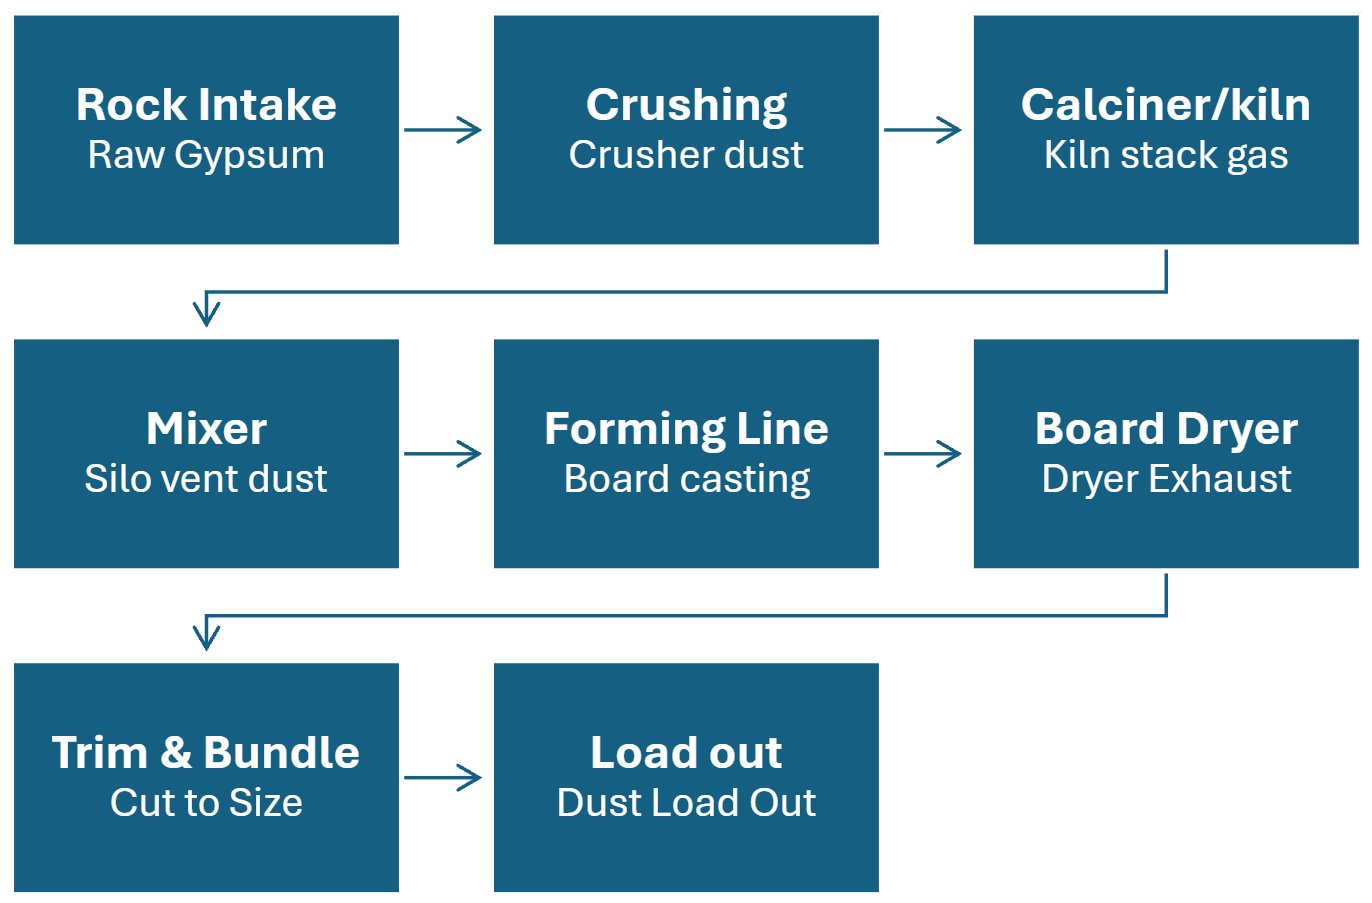
A typical plant takes raw or synthetic gypsum, either mined rock or FGD gypsum from power generation, through a series of high temperature and high friction steps. First, the rock is crushed and screened. Then it is calcined in a kiln or flash calciner to turn it into stucco. The stucco is mixed with water, starch and other additives, formed and cut on a continuous board line, dried in a multi-deck dryer, then trimmed, bundled and moved to load out. Apart from raw material stockpiles and outdoor load out, this all usually happens inside one large enclosed building.
Where dust and gas come from in a gypsum plant
As a result, each step produces its own mix of dust and gas:
- Crushing and screening: coarse and fine mineral dust
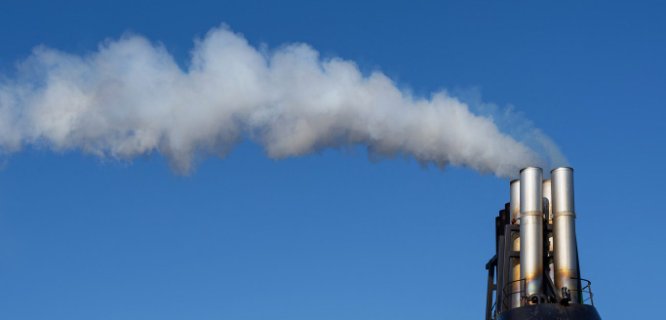
- Calcining: fine calcined gypsum dust plus burner combustion byproducts such as nitrogen oxides, sulfur dioxide and carbon monoxide
- Mixing and forming: dust at transfer points, conveyors and silo vents
- Board drying: moisture laden exhaust with fine particulate and, depending on additives and facer materials, trace volatile organic compounds (VOCs)
- Load out and bagging: handling dust
Why visibility matters
The real question for a plant is how much visibility it has into how these conditions change from hour to hour, as equipment ages, filters load up, dampers drift or a process parameter moves outside its normal range. Dust and process air also move into control rooms and offices through doorways, foot traffic and HVAC intake, which is why occupied spaces are part of the same picture.
WHY COMPLIANCE-BASED MONITORING FALLS SHORT
Most gypsum plants already do some emissions monitoring. However, it usually follows a regulatory calendar built around compliance deadlines. Stack testing typically happens once or twice a year and captures conditions at a single moment. Some plants have a continuous emissions monitoring system. Even then, it usually covers only one or two regulated stacks, since these systems are expensive to install, calibrate and maintain. The many smaller dust sources across the facility, like conveyor transfer points, silo vents, baghouse discharge points and load out areas, rarely get continuous coverage.
A lot can happen between compliance events. Filter bags degrade gradually. A damper drifts out of position. A duct or seal starts to leak, or a burner drifts off its ideal air to fuel ratio. In most plants nobody notices until dust builds up on structural steel, a worker raises a concern or the next scheduled test comes back with a bad result. By then the problem may have been costing the plant money in wasted energy, extra wear or lower product quality for weeks.
Common coverage gaps
- Periodic testing shows conditions at a single moment, not how they change between tests.
- A fixed continuous emissions monitor usually covers one or two regulated stacks and rarely reaches the smaller dust sources around the plant.
- Manual walkthroughs depend on someone noticing visible dust or an odour, and by then the condition has often been building for a while.
- Investigating after a complaint or a failed test takes time and staff labour, and rarely points straight to the root cause.
- Compliance monitoring almost never extends indoors. Control rooms, offices and break rooms sit outside stack testing and ambient sampling, even though staff spend a full shift in them.
GYPSUM PLANT OPERATING INTELLIGENCE
A plant gets more value from continuous gypsum plant monitoring when it treats the data as operating information for the whole facility. That makes it as useful to maintenance and operations staff as it is to the environmental team.
The same particulate and gas readings that describe environmental performance also describe the health of the equipment producing them. A rising particulate trend at a baghouse discharge point is often the earliest sign of a torn filter bag or failing seal, well before a compliance sample or scheduled inspection would catch it.
Sensor networks and cloud-based analytics have also become more affordable. As a result, plants can now monitor far more points than traditional instruments ever allowed. A plant can spread a larger number of lower cost sensors across the areas that matter operationally, and treat environmental compliance as one output of that network among several.
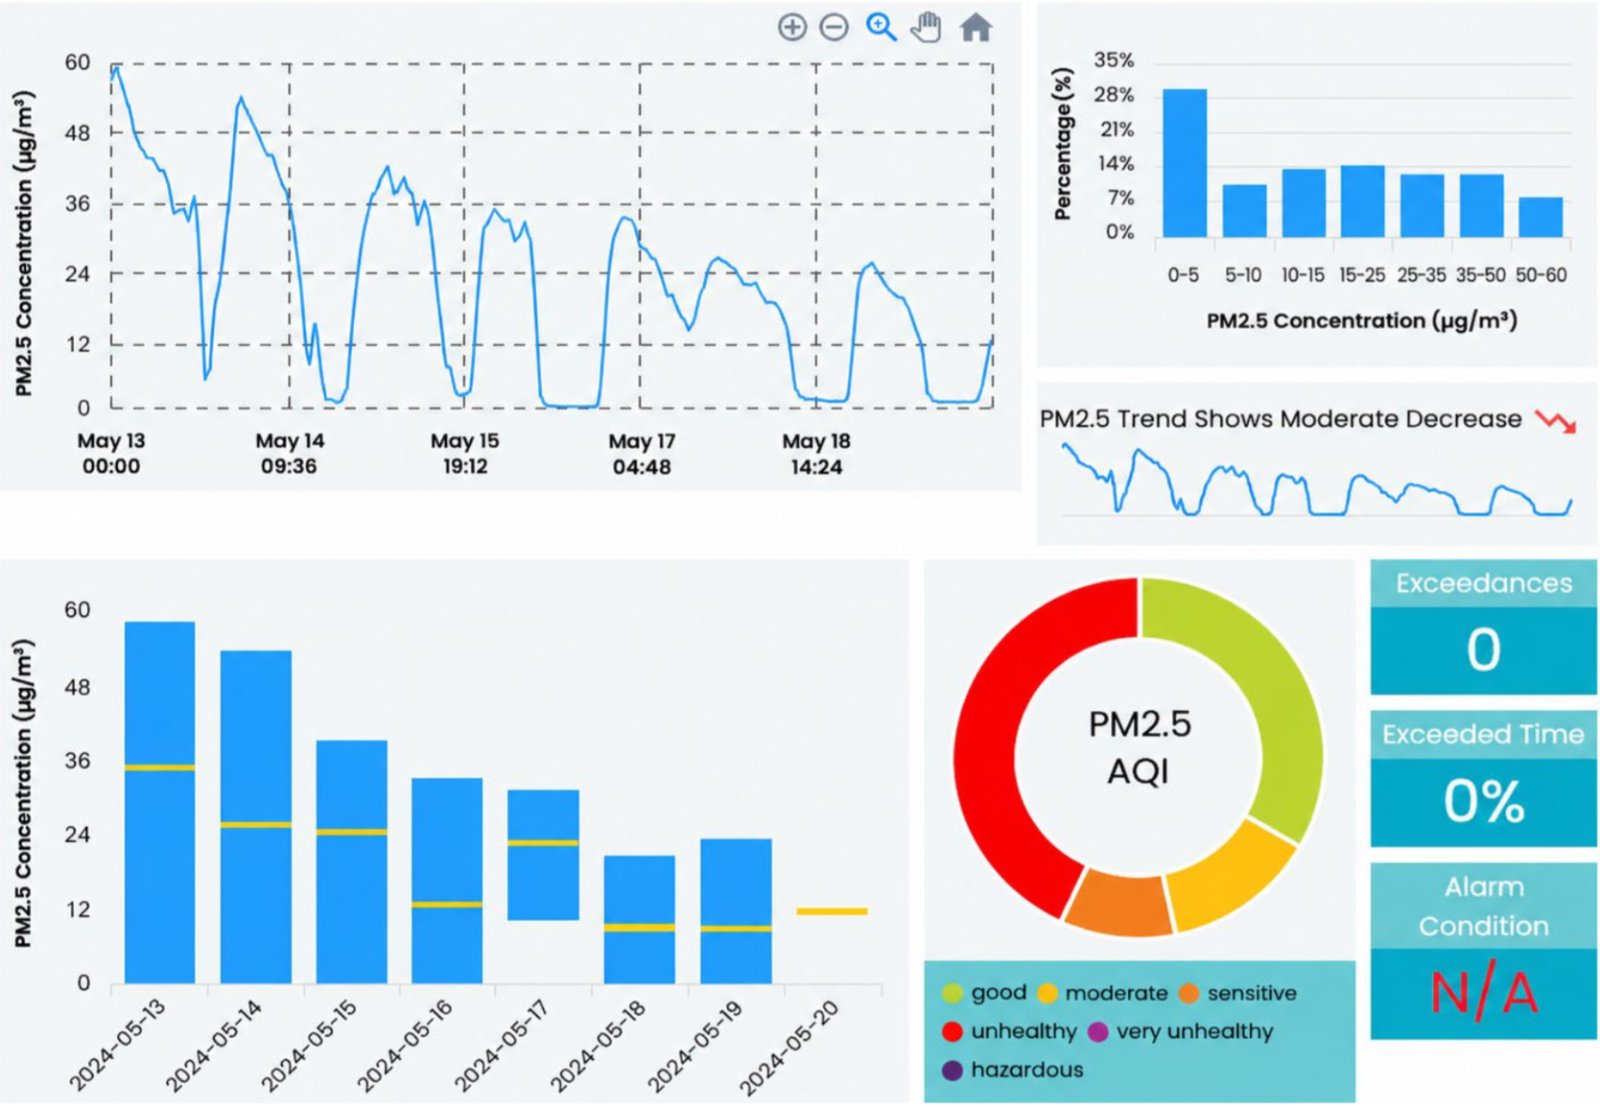
Environmental data that sits in a compliance file usually gets reviewed once a quarter, if at all. Operating data on a live dashboard, with alerts tied to a plant specific baseline, gets used by shift supervisors and maintenance planners every day.
WHAT TO MONITOR ON THE PRODUCTION FLOOR
Particle size measurements are the natural starting point for gypsum plant monitoring, since dust is the most visible and most regulated byproduct of the process. A good monitoring program should grow beyond particulate alone, both in what it measures and where.
Gypsum plant monitoring at multiple points in the process
Placing particulate sensors in several distinct zones, such as crushing and screening, the calciner and kiln area, dryer exhaust, conveyor transfer points, silo vents and load out, lets a plant see which part of the process is driving a change. Comparing PM1, PM2.5, PM4, PM10 and total suspended particulate across zones at the same time helps tell a localized mechanical issue apart from a broader process shift.
Combustion and process gases
- Nitrogen oxides, sulfur dioxide and carbon monoxide from kiln or calciner burners give an early sign of combustion or air to fuel ratio problems.
- Carbon dioxide works as a combustion indicator and, in enclosed or below grade areas, a general marker of ventilation and worker safety.
- VOCs matter where a plant uses additives, adhesives or paper facer materials that can release them.
Environmental and process conditions
- Temperature and relative humidity at the dryer and forming areas affect both product quality and how dust behaves.
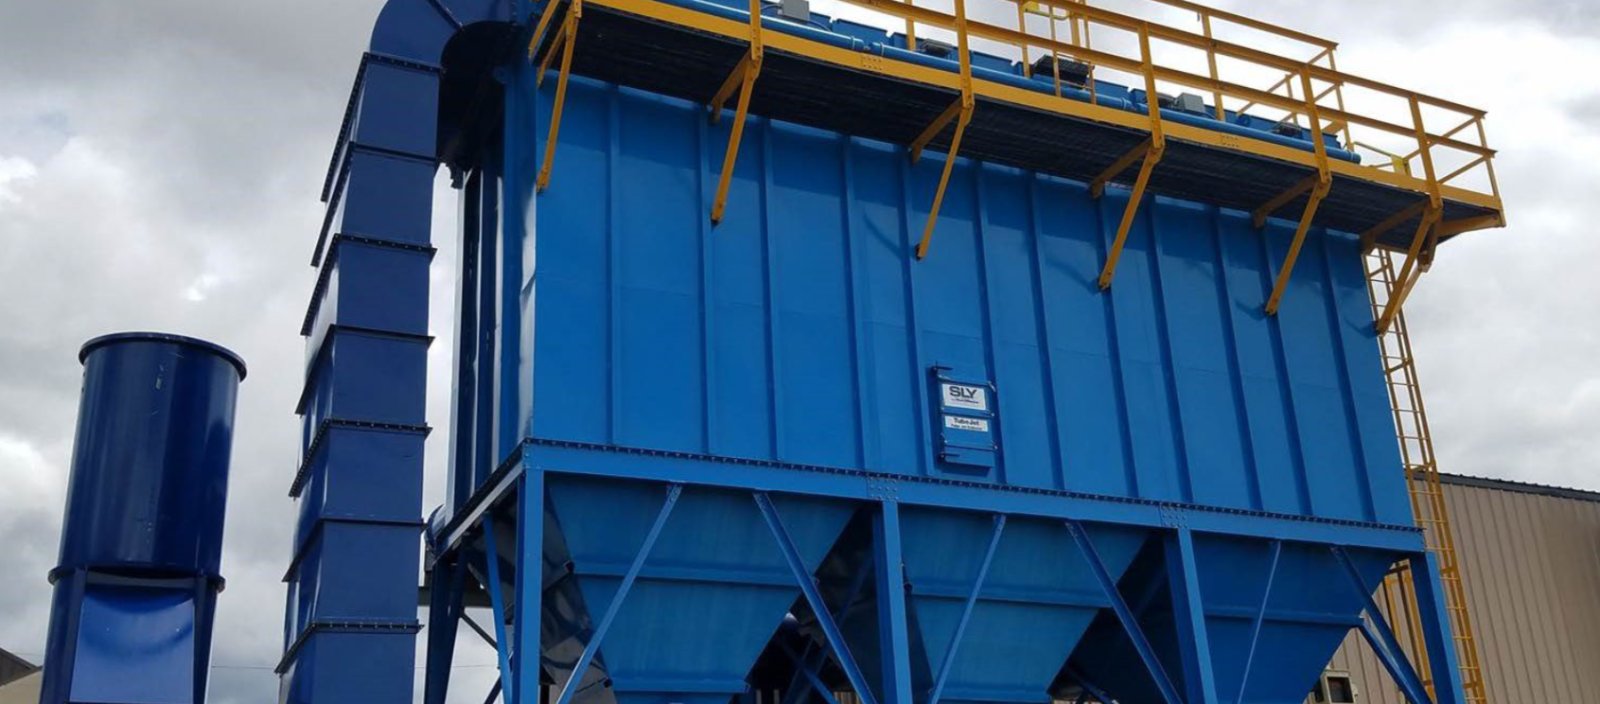
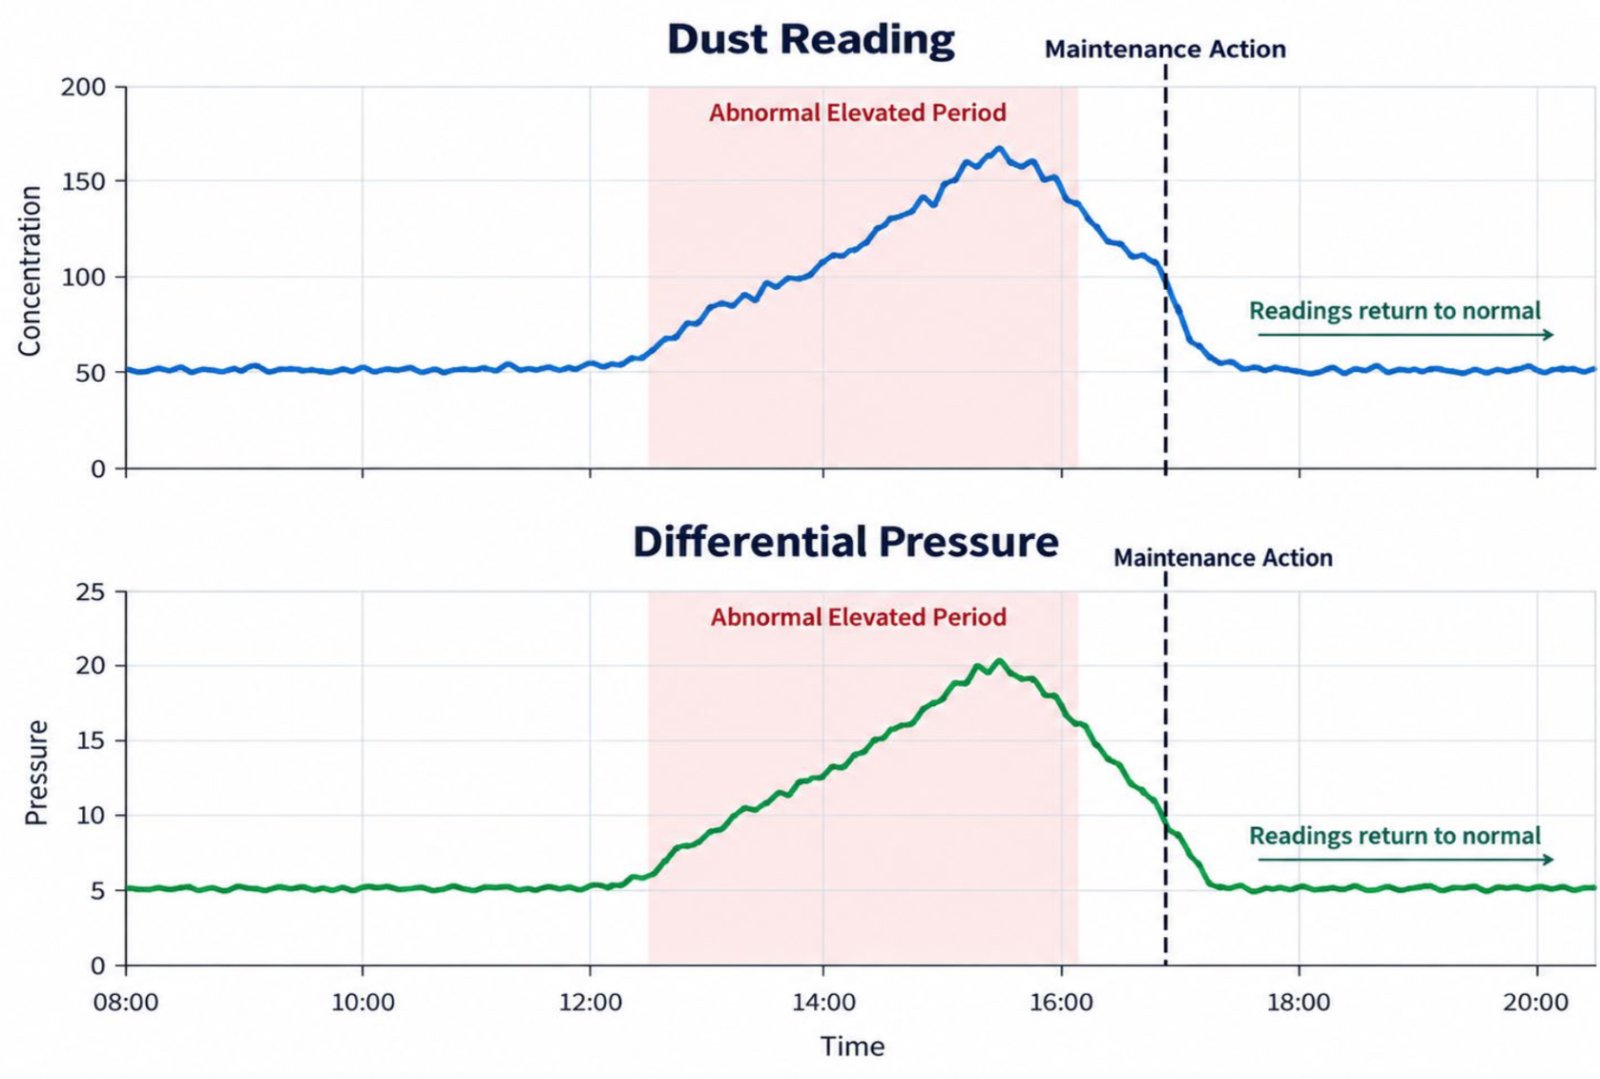
- Differential pressure across baghouses and dust collectors gives an early sign of filter loading, blinding or a developing leak.
- Noise matters in enclosed process areas where worker exposure is a concern.
Process data for correlation
Sensor readings on their own only tell part of the story. Wherever possible, line up sensor data with information the plant already collects, such as line speed, kiln or calciner temperature, burner fuel flow, fan amperage, damper position and maintenance or downtime logs. That is what turns a rising dust or gas trend into a specific, actionable finding.
WHAT TO MONITOR IN OCCUPIED SPACES
The production floor is an industrial environment built around dust and heat, not a space designed for people to sit and work in for a full shift. A gypsum plant also has occupied spaces like control rooms, offices, break rooms and labs. These rooms deserve their own look in any gypsum plant monitoring program, since the pollutants that matter are a bit different.
In a gypsum plant these rooms sit close to a dusty, high temperature process. Indoor air is often assumed to be fine because nothing looks wrong, and a short spot check misses the slow buildup over a shift. Ventilation choices are rarely guided by real time data, even though nearby process conditions can change quickly.
Particulate matter transfer
Dust from crushing, calcining and the board line does not stay where it is generated. It travels indoors through open doorways, foot traffic between zones and HVAC systems that draw intake air from near the process. A control room or office close to the kiln or board line can show particulate levels tied directly to production, not to anything happening inside the room.
Other pollutants to monitor indoors
- Carbon dioxide: a simple indicator of ventilation. Under 800 ppm is generally considered good ventilation, while readings above 1,000 ppm have been linked to reduced cognitive performance, headaches and drowsiness.
- Formaldehyde and VOCs: can come from office furnishings, and in a gypsum plant may also trace back to adhesives and resins used in board additives and paper facers. The World Health Organization recommends keeping formaldehyde under 0.1 mg/m³ over 30 minutes.
- Ultrafine particles: smaller than 0.1 micron and worth watching near the kiln or calciner, since combustion is a major source.
- Nitrogen dioxide and carbon monoxide: usually from gas fired equipment like space heaters or propane forklifts, so worth tracking in break rooms, loading docks and nearby offices.
- Radon: unrelated to the process but worth a baseline check in any occupied building. The WHO reference level is 100 Bq/m³.
- Ozone: forms outdoors and enters through infiltration. Standard HEPA filters do not remove it, so control depends on activated carbon filtration and limiting outdoor air intake during high ozone periods.
TECHNOLOGY FOR GYPSUM PLANT MONITORING
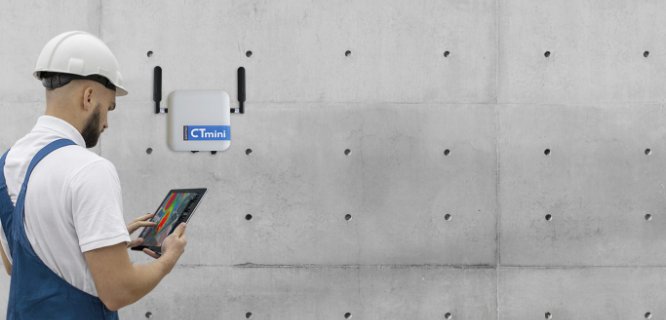
A practical gypsum plant monitoring network relies on modular, distributed sensors spread across many points. That keeps costs manageable compared with installing several high precision analyzers, each expensive to install and maintain. The network generally has three layers.
Distributed sensor nodes for gypsum plant monitoring
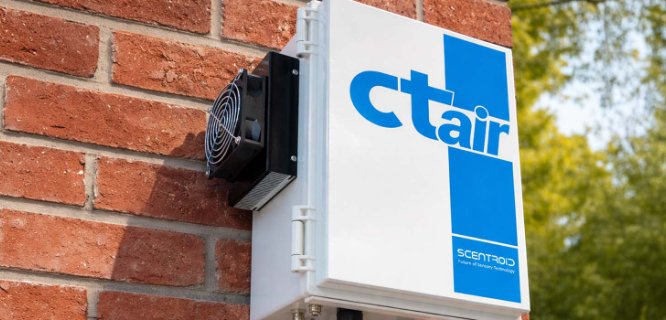
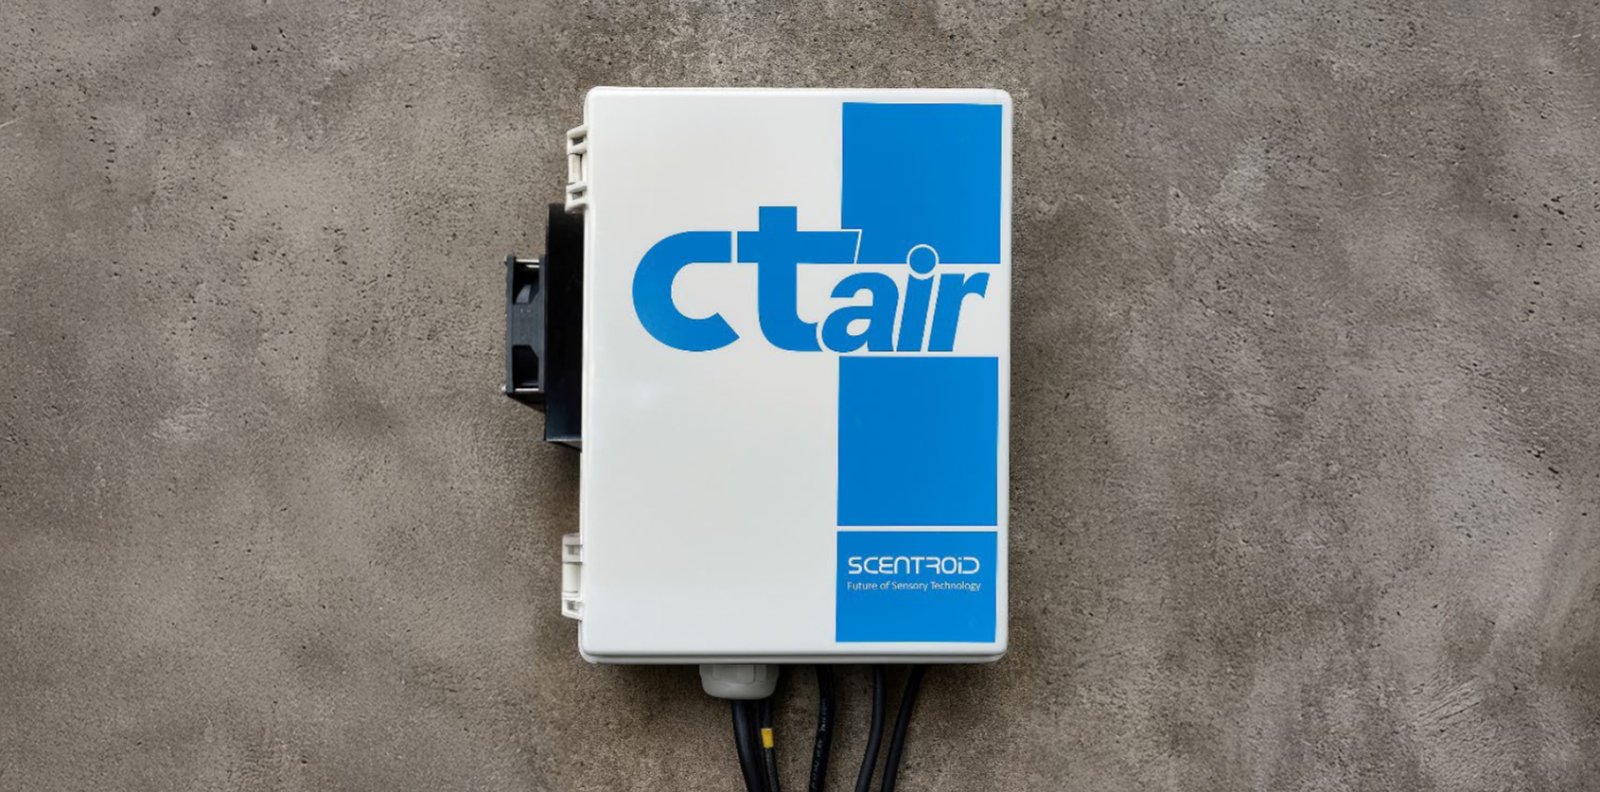
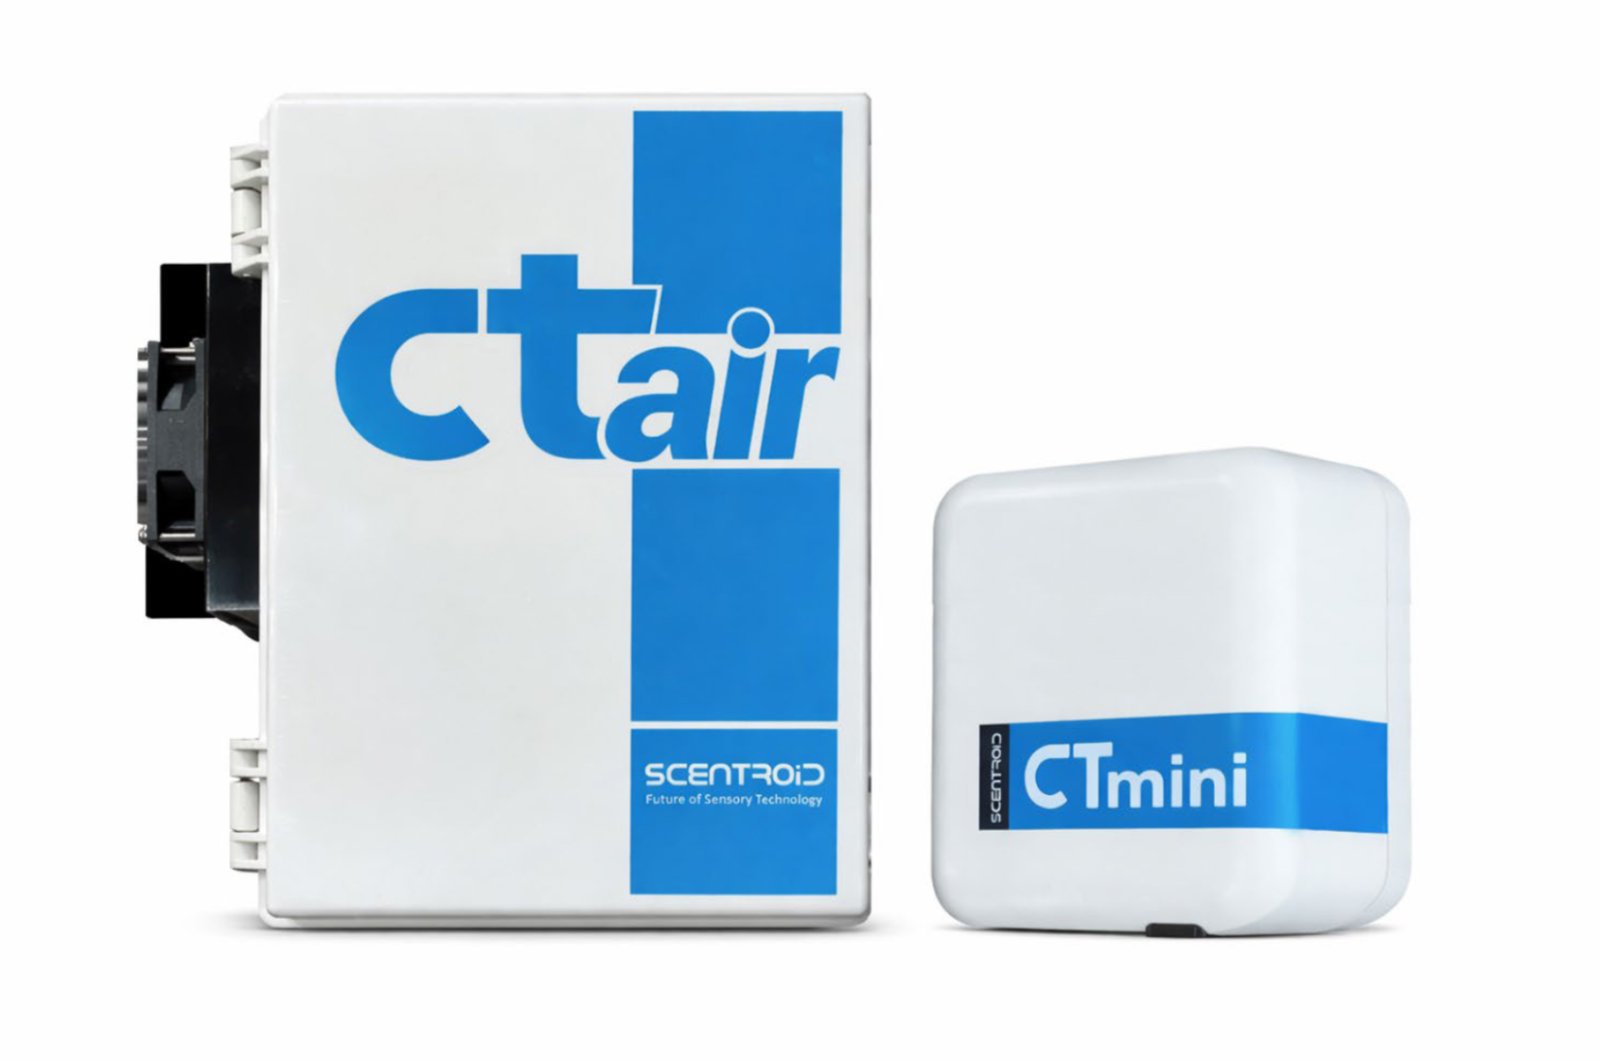
The Scentroid CTair is a good example of this kind of node. Each unit weighs about 2.5 kg and measures roughly 19 x 29 x 14 cm, small enough to mount on a wall or pole almost anywhere in a plant.
A single CTair can carry up to 11 sensors from five categories, including a laser particle counter for PM1, PM2.5 and PM10, electrochemical cells for gases, an NDIR sensor for carbon dioxide, a PID for VOCs and a metal oxide sensor for methane. A plant can start with the sensors that matter most at each point and add more later without swapping hardware.
- Runs on standard power or an optional solar module where new power lines would be costly
- Connects over Wi-Fi, cellular or LoRa, and supports Modbus TCP/IP, the protocol many plant control systems already use
- Reports to SIMS3, where alarm thresholds can trigger SMS or email alerts, a local audible alarm or automatic control of connected equipment like a misting system or sampling pump
- Backed by a 24-month warranty that covers the sensors
Sensor nodes for occupied spaces
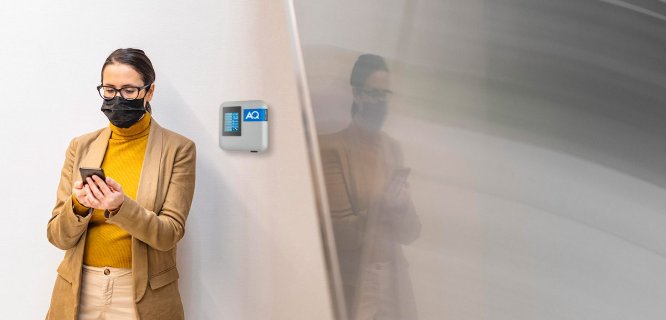
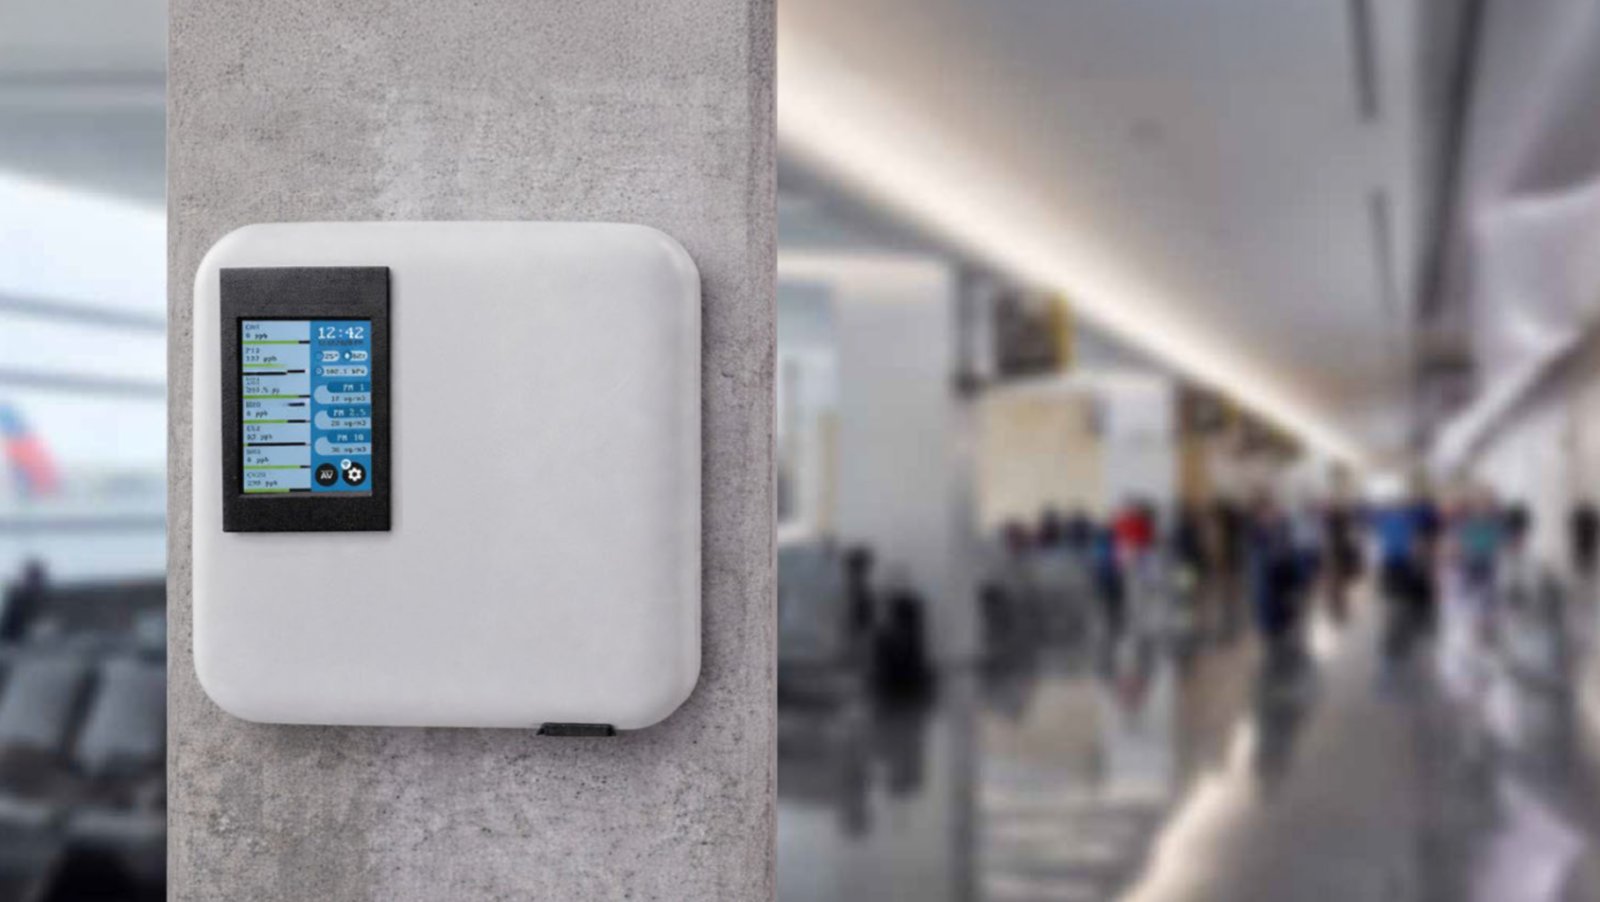
A monitor for an office or break room has different needs than one mounted on a baghouse. It should look discreet, run silently and sit in a slim enclosure. The Scentroid AQmini fits this role. It plugs into standard USB power, runs at under seven decibels and arrives pre-calibrated and ready to mount. Its screen only lights up when touched or when a reading crosses an alarm threshold.
The base unit tracks carbon dioxide, PM2.5, PM10 and nitrogen dioxide, with room for two more sensors such as carbon monoxide, formaldehyde, ozone or VOCs. It connects over Wi-Fi, Bluetooth or LoRa and reports into the same SIMS3 platform as the production floor network.
A centralized software platform
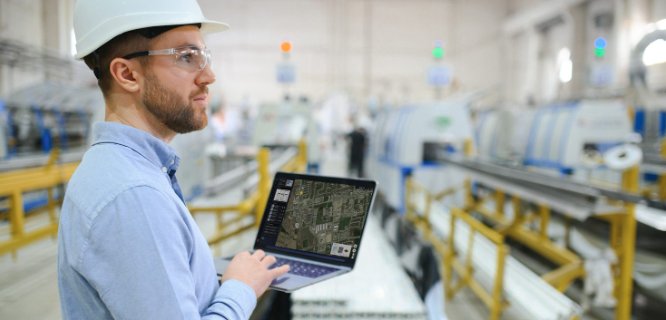
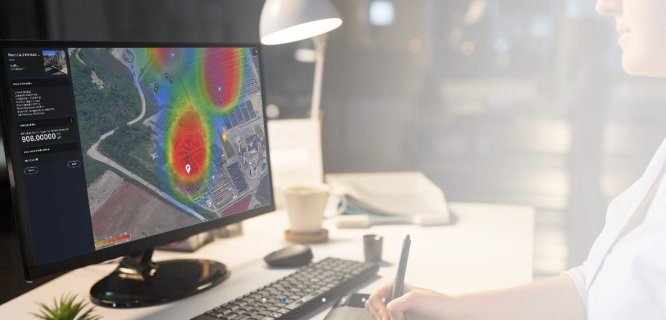
Every node sends its data to SIMS3, Scentroid’s sensor information management system. Staff use it for live dashboards, historical trends, configurable alarms and data export or API access. That turns individual readings into one picture of the whole plant that shift supervisors, maintenance planners and EHS coordinators can use without interpreting raw sensor output.
Integration with plant systems
Many plants already run a control system, SCADA or CMMS that holds process and maintenance data. Where that system can share data through a standard interface, it can be brought into the same platform or exported alongside sensor data for joint analysis. A plant can start monitoring without it, but the biggest gains usually come once it is in place.
CORRELATING SENSOR DATA WITH PLANT OPERATIONS
Production floor correlation
The value of gypsum plant monitoring grows once readings sit alongside production and maintenance data on the same timeline. A few patterns show up again and again across process industries:
- When baghouse differential pressure rises slowly, checking it against filter age and the last service date, gives maintenance a clear reason to schedule bag replacement instead of relying on a calendar or waiting for a visible failure.
- Likewise, a particulate spike at a conveyor transfer point, checked against that conveyor’s vibration alarm or motor amperage log, can narrow an investigation down to one piece of equipment in minutes instead of hours of walking the line.
- A shift in gas readings near the kiln, checked against burner fuel flow and kiln temperature, can flag a combustion tuning issue before it becomes a compliance exceedance or a loss in fuel efficiency.
Over time this builds a plant specific baseline for what normal looks like across production rates, ambient conditions and product runs. Once that baseline exists, the system can flag a truly abnormal reading automatically.
Combining production floor and occupied space data
Run together on one platform, production floor and occupied space sensors give a complete picture of conditions across the site. A rising carbon dioxide reading in a control room next to the kiln means something different depending on what the process sensors show. If production is running normally, it likely points to a ventilation or HVAC issue in the room. If a nearby process sensor also shows an unusual reading, the two together point to a shared cause, like a door left open near a dusty area or a duct pulling process air into an occupied space.
A plant already running a pilot on the production floor can add a few occupied space points without new software or training. The result is one dashboard, one set of alarms and one record for the whole site.
ECONOMIC BENEFITS AND THE 90-DAY PILOT
Economic benefits
Much of the cost tied to dust and process upsets never shows up as its own line item. It shows up as staff time spent walking the plant to trace a complaint or failed sample, unplanned downtime when a problem only becomes visible after it has escalated, and filter media or collector parts replaced too early out of caution or too late because nobody caught the warning signs. There is also regulatory risk and worker exposure to dust.
A continuous, distributed sensing layer turns several of these costs into numbers a plant can track, like hours spent diagnosing an abnormal condition, downtime avoided and extra life gained by replacing parts based on condition instead of a fixed date. Because a modular sensor network costs little compared with one significant upset or unplanned outage, most plants can test the economics at a small scale first.
Structuring a 90-day pilot
A gypsum plant monitoring pilot typically covers five to ten monitoring points chosen for their operational importance. Good candidates include the calciner and kiln area, the main baghouse, a representative conveyor transfer point, the board dryer exhaust, the load out area and a nearby control room or office.
- Scoping and installation (weeks 1 and 2): a site walk to confirm monitoring points, a review of available process and maintenance data, and installation of sensor nodes and software.
- Continuous data collection (weeks 3 to 10): live dashboards run around the clock, with weekly reviews against production and maintenance events and joint investigation of any abnormal readings.
- Analysis and scale up decision (weeks 11 to 13): the team compares pilot data with the KPIs agreed at the start and makes a data backed recommendation on whether and how to expand.
The key is agreeing on success criteria before installation. A pilot without KPIs set in advance tends to produce interesting data and an unclear decision.
Pilot KPIs to consider
- Abnormal conditions caught that would have been missed between scheduled tests or walkthroughs
- Average time to find the source of a dust or process problem compared with past events
- Times a sensor trend led the team to a specific mechanical or process cause
- Investigation and maintenance hours saved through faster root cause work
- Unplanned downtime avoided or shortened
- Feedback from EHS, maintenance and operations staff on the dashboard and alerts
- Ventilation or indoor air issues found and fixed in occupied spaces
Getting started
Dust, moisture and combustion byproducts are a normal part of gypsum wallboard manufacturing. What varies from plant to plant is how much visibility operations and EHS teams have into how those conditions change, and how quickly they can trace a problem back to its source. Choose a small number of points that matter operationally, monitor them continuously, and let the data make the case.
Download the full white paper (PDF), see how Scentroid supports manufacturing plants, or contact us to talk about a pilot assessment for your site.
FREQUENTLY ASKED QUESTIONS
Why should a gypsum plant monitor dust continuously?
Periodic stack tests and walkthroughs only show conditions at a single moment. Continuous gypsum plant monitoring catches problems like torn filter bags, leaking seals or drifting burners as they develop, often weeks before a scheduled test or visible dust buildup would reveal them.
What should a gypsum wallboard plant monitor besides particulate?
Along with PM1, PM2.5, PM10 and total suspended particulate, plants benefit from tracking nitrogen oxides, sulfur dioxide, carbon monoxide and carbon dioxide from burners, VOCs from additives and facers, temperature and humidity at the dryer, differential pressure across baghouses, and noise in enclosed areas.
Why monitor control rooms and offices in a gypsum plant?
Dust and process air travel indoors through doorways, foot traffic and HVAC intake. Monitoring carbon dioxide, particulate, formaldehyde and other pollutants in occupied spaces protects staff and helps tell a ventilation problem apart from a process problem.
What equipment does Scentroid use for gypsum plant monitoring?
Scentroid uses CTair sensor nodes on the production floor, which can carry up to 11 sensors and connect over Wi-Fi, cellular or LoRa with Modbus TCP/IP support, AQmini monitors in occupied spaces, and the SIMS3 software platform for dashboards, alarms and data correlation.
How does a 90-day monitoring pilot work?
A pilot usually covers five to ten monitoring points. Weeks 1 and 2 cover scoping and installation, weeks 3 to 10 are continuous data collection with weekly reviews, and weeks 11 to 13 are analysis against agreed KPIs and a scale up decision.
What KPIs should a gypsum plant pilot track?
Useful KPIs include abnormal conditions caught between scheduled tests, time to find the source of a problem, maintenance and investigation hours saved, unplanned downtime avoided, staff feedback on dashboards and alerts, and indoor air issues resolved.