WHITE PAPER:
VIRAL
TRANSMISSION
SCORE
Table of Contents


Section 1:
INTRODUCTION TO AMBIENT AIR QUALITY MONITORING
Ambient air monitoring is the act of performing a long-term assessment of the surrounding air to measure the quantity and types of pollutants present. These assessments are typically completed for various reasons, including:
- Determining the threat level of a space and the extent of pollution
- Providing accurate air pollution data to the public in a timely manner
- Supporting the implementation of air-quality standards
- Evaluating the overall effectiveness of mitigation strategies
- Mapping and studying air quality trends
- Providing data to create air-quality models
- Supporting a hypothesis or research problem
Several sensor varieties exist, along with ambient air monitoring instruments, to measure a specific pollutant in any given space, whether indoors or outdoors. Developers must also consider several factors when creating the technology, including the uses of the data, the equipment’s investment costs, operational costs, reliability, and the overall ease of operation.
Determining which locations to use is an essential component of any successful air quality monitoring project. For this program, we will assume that measurements support human health objectives. According to the EPA, a typical individual spends approximately 90 percent of their time indoors. In addition, inadequate maintenance of heating, ventilation, humidity, and pressure can contribute to health and safety concerns (Government of Canada). To address this problem, monitoring stations must be placed in highly centralized population centers and areas with more than one occupant within an enclosed space.
Section 2:
VIRAL TRANSMISSION MONITORING BACKGROUND
Viral disease transmission occurs mostly in indoor spaces where groups of individuals assemble. This is especially true for known airborne viruses such as COVID-19 and SARS. Several factors contribute to the virus’s transmission from one individual to the next when both are present in the same enclosed air space. These factors include occupancy-to-air-volume ratio, occupancy-to-fresh-air intake, relative humidity, temperature, and fine particulate concentration in the air. Both public and private establishments can significantly reduce the chances of viral transmission among occupants by optimizing these parameters through better building and HVAC design, as well as controlling occupancy loading.
Currently, no instruments on the market provide a thorough analysis of viral transmission monitoring. All previously developed systems focus only on detecting an infectious person or a specific virus within a monitored environment. This approach does not consider the parameters that facilitate the transmission of infection from one person to another within the monitored space.
Section 3:
WHAT IS VIRAL TRANSMISSION MONITORING?
Scentroid has created a system that measures several air quality parameters based on scientific studies linking environmental factors to the movement and transmission of viruses such as COVID. In the context of ambient air quality monitoring, devices with specific sensor configurations can track relevant ambient air quality data in key locations.
To fully assess the quality of indoor spaces for viral transmission, we need a single numerical value known as the Viral Transmission Score (VTS). VTS analyzes each of the factors mentioned in this paper and determines their combined effect. This single numerical value correlates with the probability of airborne virus transmission between occupants if any are contagious. This viral transmission score can aid in:
- Determination of 2 occupancy loads in real-time
- Providing an alarm for highly contagious environments
- Allowing regulators to set limits to force establishments to improve HVAC / building design.
An algorithm represents this numerical value on a scale of 1-10. A low number will indicate a lower transmission rate of COVID, and a high number indicates a higher transmission rate.
1-5 ideal/low
5-8 Moderate
8-10 Critical
Section 4:
CREATING THE VTS FORMULA: FUNDAMENTALS
Water Droplets vs COVID-19 Transmission
COVID-19 transmission links to the transfer of water droplets generated through a cough, sneeze, or even speech between two people in proximity. According to the Journal of New England Medicine, 1 minute of loud speaking can generate at least 1,000 virion-containing droplet nuclei, which can remain airborne for more than 8 minutes (Anfinrud). Measured airborne particles at the point of creation are larger than 12 µm in diameter and diminish to 4 µm toward the end of their life cycle. Additionally, the water in respiratory droplets evaporates rapidly, leaving microscopic particles called aerosols that can travel long distances through indoor air currents.
According to Stoke’s law, the terminal velocity of a falling droplet scales with the square of its diameter (Eriko Kudo, E.S.). As the droplet size decays over time, the rate of fall also diminishes, allowing the particles to travel freely through the air. In areas of high air movement (not necessarily high circulation, as air intake systems may not perform optimally), water droplets can rapidly move and transfer from person to person, contributing to viral transmission.
Regarding droplets in the air, both volume and count increase with varying loudness of voice, vocal vibrations, and the presence of sneezing and coughing. In stagnant air, droplets persist as a slowly descending cloud emanating from an individual’s mouth, with the overall rate of descent controlled by the dehydration of speech droplets.
According to the National Library of Medicine, for COVID-19, “With an oral fluid average virus RNA load of 7 × 10^6 copies per milliliter (maximum of 2.35 × 10^9 copies per milliliter), the probability that a 50-μm-diameter droplet, prior to dehydration, contains at least one virion is ∼37%. For a 10-μm droplet, this probability drops to 0.37%, and the probability that it contains more than one virion if generated from a homogeneous distribution of oral fluid is negligible” (S.N. Rudnick).
These findings imply that airborne droplets pose significant risks for human-to-human viral transmission for respiratory illnesses such as COVID-19, influenza, and measles. By establishing a standardized monitoring system, researchers can investigate these droplets at varying sizes, accommodating the principles of dehydration decay, and determine the overall concentration of droplets in any given space. This serves as the first measurement in our Viral Transmission Score formula algorithm.
Relative Humidity, Temperature, and the Effects on Viral Survival Rates
With seasonal changes, noticeable differences between the spread and transmission of COVID-19 were identified. Through an attempt to discover the reasons behind this phenomenon, teams of researchers conducted systematic reviews of the transmission of respiratory illnesses (including COVID-19) and the effects of varying weather factors (Paulo Mecenas). Assessing a COVID risk factor through relative humidity and temperature variances must be considered upon determining a standardized Viral Transmission Score formula (VTS).
In a clinical study, high temperature and humidity together displayed a combined diminishing effect of corona-viruses. The opposite weather conditions were shown to support a prolonged survival time of the virus on surfaces, further facilitating the transmission and susceptibility of the viral agent (K.H. Chan, J.M.). Increased temperatures and increased humidity are frequently connected to a reduction of the transmission of respiratory viruses. This is due to the virus being more stable in cold temperatures, and respiratory droplets remaining in suspension for longer periods of time in drier air (Anice C. Lowen). These colder climates are also capable of compromising a host’s immunity, further making them more susceptible to the virus (Eriko Kudo).
As viruses can be carried on varying water droplet sizes, the number of droplets found in ambient air could change based on several factors. Analyzing temperature and humidity is key to creating an accurate representation of the number of viral agents present.
With that in mind, initial studies have revealed that maintaining a humidity range of 40-60% within an indoor space could slow the spread of COVID-19. We also understand that warm and wet climates assist with a reduction in the spread of COVID-19. However, as per the Public Library of Science, these variables alone could not explain most of the variability in disease transmission (Paulo Mercenas, R.T). Several other factors must be calculated to quantify and produce an accurate VTS.
Particulate Matter and Its relationship to COVID
A positive correlation exists between the spread of COVID-19 and increased air pollution. Small particles can act as carriers, conveying the virus and increasing its spread.
An analysis by the New England Journal of Medicine fully investigated the stability of COVID in aerosols and on surfaces. In their study, researchers determined the half-life of a COVID molecule on common airborne surfaces such as plastic, steel, cardboard, and copper. Despite some surfaces being less hospitable for the virus, COVID remained on all four aerosols for 3 hours, slowly reducing its infectious capabilities over time (S.N. Rudnick). The study indicated that the virus could persist on surfaces for days and in aerosols for hours.
Water droplet transmission tends to be short-range due to size, weight, and travel distances before falling to the ground. However, aerosol-based transmission involves a suspension of solid particles within a gas phase. These particles range in size from 0.001 to 100 µm. Small sediment particles can easily travel long distances due to airflow.
Particulate matter causes an inflammatory response in our lungs by creating inflammation at various contact points. The rise in inflammation may increase the severity of the virus in heavily polluted areas, as the virus binds to enzyme receptors. Upon binding, the enzyme releases an anti-inflammatory peptide (Neeltje van Doremalen), which becomes over-expressed due to inflammation from frequent PM exposure. This further increases the probability of COVID taking hold within a host body.
Indoor air quality has proven significantly more hazardous to health than outdoor air quality. According to the EPA, indoor air pollution levels often reach 2 to 5 times higher than outdoor levels. In certain cases, due to poor ventilation and air circulation, these levels might exceed 100 times those found outdoors (USEPA).
Thus, individuals in closed spaces who frequently experience higher levels of ambient air pollution are more likely to contract COVID-19 or other airborne respiratory illnesses. These findings provide an essential starting point for determining the overall risk and connections between COVID-19 and PM pollution, serving as a crucial component in viral hazard calculation.
CO2 Being Used as a Risk Proxy for Indoor Spaces
Approximately 90% of our time occurs indoors, according to the Environmental Protection Agency (USEPA). Since we spend most of our time in indoor environments, limited air volumes allow aerosols carrying viruses to accumulate easily. Combating indoor COVID transmission has become a high priority, as it plays a key role in mitigating the negative impacts of a pandemic on society and the economy. We need practical methods for monitoring and limiting indoor transmission.
Indoor CO2 levels serve as a practical proxy for assessing respiratory infectious disease transmission and risks (S.N. Rudnick). Although COVID-19 can travel on both aerosols and particulate matter, this correlation does not help with viral hazard tracking without considering a viral host.
As infected individuals exhale pathogen-containing aerosols, tracking changes in CO2 levels can indicate potential viral transmission hazards. When ambient CO2 levels remain stable, an excess of CO2 typically signals exhalation. Measuring fluctuations in indoor CO2 concentration often serves as a powerful indicator of infection risk. By analyzing the number of occupants, average exhalation rates, ventilation protocols, and any external CO2 sources, researchers can derive a rudimentary formula (Jimenez, Z. P.).
However, different functions may require different formulas. The breathing rate of an individual performing intense physical activities differs dramatically from that of individuals at rest. Thus, a single recommendation for CO2 thresholds cannot apply universally; the formula must adapt to various environments and situations. To effectively assess an indoor space, advanced sensors that track occupant traffic or provide high-accuracy CO2 measurements may be necessary.
Therefore, we can create thorough guidelines for indoor CO2 concentrations to further develop a formula for Viral Transmission Monitoring.
Section 5:
BUILDING EFFECTIVE EQUIPMENT TO PROCESS RAW DATA & VTS
To effectively collect data, an indoor stationary device is necessary, and it must be appropriately sized to house a sensor payload suitable for creating an in-depth analysis of a space’s Viral Transmission Score (VTS). It should also have a screen or an effective communication method to display any hazards quickly and to convey a rapidly increasing VTS.
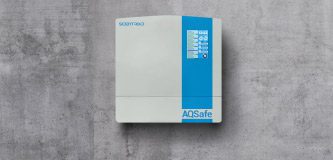
We chose our Scentroid AQSafe Indoor Air Quality Monitor.
The AQSafe Indoor Air Quality Monitor observes the air quality of an enclosed space using a wide range of sensors. Our sensors detect dust (PM1, PM2.5, and PM10), carbon dioxide, temperature, humidity, pressure, and many other chemical compounds found indoors in public facilities or spaces.
The AQSafe features a compact, low-profile design, making it easy to install and operate. The touchscreen provides control over various advanced gas sensor technologies designed to monitor areas of concern. It has proven long-term stability, and all sensors have undergone calibration and preparation. The AQSafe prioritizes labor-saving, cost-effective solutions while enhancing health and comfort.
The AQSafe includes built-in software for graphical representation, statistical data, and alarm systems (including text message and email notifications), making it ideal for calculating and communicating a hazardous VTS immediately in real time.
Section 6:
UTILIZING THE VTS FORMULA IN SEVERAL SCENARIOS
Hospitals
Through careful and continuous monitoring of ambient indoor air, the AQSafe is capable of pinpointing COVID risks such as stagnant air, increased traffic, or even a malfunctioning or inadequate HVAC system. Through the sending of monitored information in relation to a building’s ventilation system, the optimization of air exchange rates is made possible, and can be automatic depending on the setup of the instrument.
AQSafe can play a key role in ensuring critical spaces are safe from contamination. Through monitoring pressure, the AQSafe provides a safeguard against air leaks and ensures the HVAC system is providing adequate positive pressure for air isolation. Once the pressure drops below a particular threshold, the AQSafe can relay a warning that ambient air has been compromised. The use of disinfectants and sanitizers in general will release harmful volatile organic compounds into the air causing short-term and long-term health effects on patients, staff, and even visitors. UV disinfectants used widely in hospital isolation rooms can cause free ozone to be released indoors, potentially resulting in severe health issues.
Public Transportation
An important factor to consider is how an airborne virus behaves in regards to airflow in an underground transit system. By monitoring CO2, the AQSafe can assess various COVID risks such as stagnant air, increased traffic, or even a malfunctioning or inadequate air recycling system. Currently, a typical transit system recirculates approximately 70 percent of the air within, with 30 percent being pulled from the outdoors (Julia Knope). The filters used have a Minimum Efficiency Reporting Value (MERV) of 8. MERV ratings increase up to 20 – the higher the number, the smaller the particles a filter can trap.
Filtration on a subway or train car can trap larger particles like mold spores, pollen, fibers, and dust – however, airborne viruses will remain. During times of low usage and traffic, the AQSafe can reduce HVAC activity or potentially increase airflow cycles once VTS begins to approach hazardous levels.
School Safety
Students, school staff, and parents remain concerned about preventative COVID measures and whether schools meet appropriate ventilation and air quality standards. A push against at-home learning could lead to more students and staff returning to school and staying indoors despite the overall lack of government information regarding mandated inspection of ventilation systems. Poor ventilation increases the risks of super-spreader events. The risk of catching COVID-19 indoors is 18.7 times higher than in the open air (CDC), according to the US Centers for Disease Control and Prevention.
As school systems typically exist in denser urban areas, they are more likely to collect particulate pollution from outdoor sources. These small airborne particles could potentially carry COVID-19 and other viruses on their surfaces. By installing an AQSafe and communicating the Viral Transmission Score to anyone requesting it, confidence in school safety measures will gradually rebuild (Canadian Press).
Public Spaces
With the AQSafe, a user can create an alarm system that warns of increased CO2 levels. In some of the most modern venues in Japan, facilities have stationed screens displaying CO2 levels throughout the space. For example, in Tokyo’s Chiyoda Ward, a large screen has been installed at the edge of concert stages. During live events, the screen changes color to indicate increases or decreases in carbon dioxide. Attendees receive a notification at the start of every performance: “The hall is well ventilated, so enjoy our performance without any worries.” These same systems now appear in restaurants, airports, and other public spaces (Nonaka R.).
Displaying airborne CO2 concentrations makes a clear statement about whether a site is properly ventilated. However, further monitoring is necessary to adequately prevent the three C’s of COVID-19 transmission: Closed, Crowded, and Close-Contact settings. With air-quality monitors and the Viral Transmission Score system, visitors can feel assured that they are in a safe and monitored indoor space.
Connecting and Controlling HVAC systems
The AQSafe allows users to monitor an HVAC system to ensure facility occupants remain protected. It achieves this through real-time, high-accuracy air-quality monitoring based on temperature, humidity, and several other environmental factors. By capturing data related to an indoor area’s ventilation system, the AQSafe and its built-in VTS algorithm increase HVAC efficiency as needed to lower the viral transmission score. Once a lower VTS is achieved, the AQSafe helps reduce energy costs by optimizing air exchange rates.
What fail-safes do HVAC providers implement within a facility? A typical high-grade HVAC system can fail due to a lack of maintenance, aged and uncleaned filters, pilot light malfunctions, mechanical wear and tear, ventilation failure, blown fuses, or dirty condenser or evaporator coils. The AQSafe warns users immediately of any major changes to indoor air and continues to provide a viral transmission score based on these factors.
Section 7:
CASE STUDY: DATA COLLECTION WITHIN A PHARMACY
An AQSafe equipped with Viral Transmission Score technology monitored potential COVID transmission risks within a pharmacy in Canada for several days. As illustrated in Figure A, daily cycles appear after prolonged occupancy with low fresh-air intake. During times of high occupancy, the rate of CO2 change increases with continual occupancy. As customers and staff leave and the occupancy level decreases, the CO2 level drops. This cyclic process occurs every 24 hours, with some deviation due to changes in occupancy. Therefore, the VTS accurately indicated the danger of continual airborne viruses and remained high.
Figure B shows temperature variations within the space, which also follow a cyclic pattern over the 24-hour period. Temperatures rise with higher occupancy and fall with reduced occupancy. Ambient temperature also influences the indoor space temperature to some extent.
Figure C highlights disturbances to airborne dust particles, creating small spikes in particulate matter readings and changes in the VTS score. These particles travel within the airspace, remaining airborne until filtration or fresh air exchange removes them. Increasing air filtration may help reduce particulate matter concentration.
As the air filtration rate increases, the relative humidity decreases. Figure D displays cumulative behavior regarding variations in relative humidity within the space.
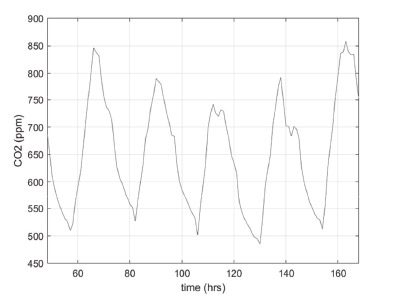
Figure A
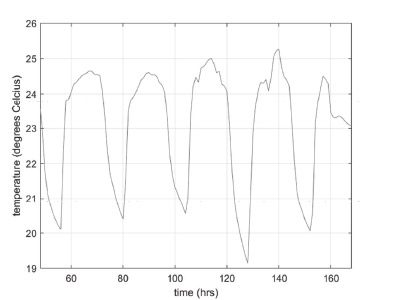
Figure B
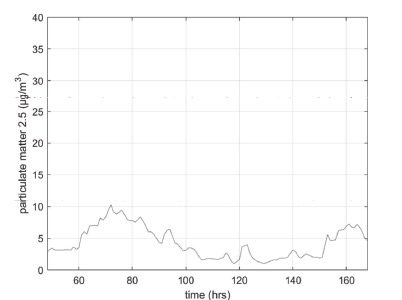
Figure C
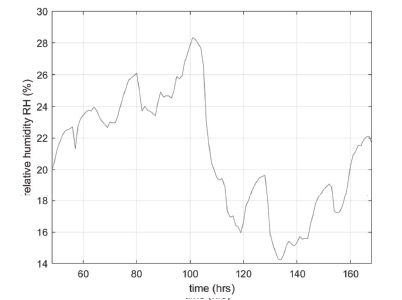
Figure D
The results demonstrate the importance of the interaction among all measured parameters. For example, although occupancy did not increase between 130 and 170 hours, as shown by the CO2 measurements, the VTS score exceeded the Moderate range due to low humidity levels. The facility manager can use this information to improve humidification in the space and ensure a safer environment for occupants.
Figure E
Section 8:
CONCLUSION
The objective of the Viral Transmission Score (VTS) is to provide a singular metric that assesses the conditions of an indoor environment for the transmission of infectious diseases among occupants. This metric encompasses factors that affect the probability of viral transmission, including occupancy rate, fresh air intake, temperature, humidity, and particulate concentration. This will allow:
- Government regulators to set VTS limits that keep occupants safer than simple occupancy limits.
- Rapid inspection and continuous monitoring of an indoor space to identify deficiencies in HVAC systems, occupancy control, and other factors that affect occupant safety in terms of disease transmission.
- Building engineers to consider viral transmission when designing new spaces to ensure occupant safety.
The AQSafe and the Viral Transmission Score system aim to restore confidence in facilities that had to close during the pandemic and help front-line workers feel safer in their environments. This technology will revolutionize sensory technology and change our perception of the air we breathe in indoor spaces.
Bibliography
Anfinrud (Ph.D.), P., Sadnytskyi (Ph.D.), V., Bax (B.A.), C. E., & Bax (Ph.D.), A. (2020, April 15). Visualizing Speech-Generated Oral Fluid Droplets with Laser Light Scattering | NEJM. Retrieved from New England Journal of Medicine: https://www.nejm.org/doi/full/10.1056/NEJMc2007800?query=featured_hom
Anice C. Lowen, J. S.-C. (2014, July). Roles of Humidity and Temperature in Shaping Influenza Seasonality. Retrieved from American Society for Microbiology: https://jvi.asm.org/content/88/14/76922235945/
Canadian Press. (2021, January 24). Education Unions are Urging the Government to Test Air Quality in All Schools | CTV News. Retrieved from CTV News: https://montreal.ctvnews.ca/education-unions-are-urging-the-government-to-test-air-quality-in-all-schools-1.5280098
CDC. (2020, October 5). Scientific Brief: SARS-CoV-2 and Potential Airborne Transmission | CDC. Retrieved from Centers for Disease Control and Prevention: https://www.cdc.gov/coronavirus/2019-ncov/more/scientific-brief-sars-cov-2.html
EPA. (2020, August 9). The Inside Story: A Guide to Indoor Air Quality | Indoor Air Quality (IAQ) | US EPA. Retrieved from United States Environmental Protection Agency: https://www.epa.gov/indoor-air-quality-iaq/inside-story-guide-indoor-air-quality
Eriko Kudo, E. S. (2019, May 28). Low Ambient Humidity Impairs Barrier Function and Innate Resistance Against Influenza Infection. Retrieved from PNAS; Proceedings of the National Academy of Sciences of the United States of America: https://www.pnas.org/content/116/22/10905
Government of Canada. (2021, February 15). Indoor Air Quality – General – OSH Answers. Retrieved from Canadian Center for Occupational Health and Safety: https://www.ccohs.ca/oshanswers/chemicals/iaq_intro.html
Jimenez, Z. P. (2020, September 10). Exhaled CO2 as COVID-19 Infection Risk Proxy for Different Indoor Environments and Activities. Retrieved from Cold SPrint Harbor Laboratory: MedRXIV, Preprint Server for Health Sciences: https://www.medrxiv.org/content/10.1101/2020.09.09.20191676v1.full.pdf
Julia Knope, C. (2020, January 6). Study Finds ‘Elevated’ Levels of Air Pollutants in Toronto’s Subway System | CBC News. Retrieved from CBC News: https://www.cbc.ca/news/canada/toronto/toronto-subway-air-pollution-toronto-public-health-1.5415993
K.H. Chan, J. M. (2011, October 1). The Effects of Temperature and Relative Humidity on the Viability of the SARS Coronavirus. Retrieved from Hindawi Open Access Research and Papers: https://www.hindawi.com/journals/av/2011/734690/
Neeltje van Doremalen (Ph.D.), T. B. (2020, March 17). Aerosol and Surface Stability of SARS-CoV-2 as Compared with SARS-CoV-1. Retrieved from US National Library of Medicine: https://www.ncbi.nlm.nih.gov/pmc/articles/PMC7121658/
Nonaka, R. (2020, October 23). Screens Showing CO2 Level Set Up at Venues to Lessen Virus Risk – The Asahi Shimbun. Retrieved from The Asahi Shimbun, Asia and Japan Watch: http://www.asahi.com/ajw/articles/13832094
Paulo Mecenas, R. T. (2020, September 18). Retrieved from PLOS One Peer Reviewed Scientific Journals: https://journals.plos.org/plosone/article?id=10.1371/journal.pone.0238339
S.N. Rudnick, D. M. (2003, September 1). Risk of Indoor Airborne Infection Transmission Estimated from Carbon Dioxide Concentration – PubMed. Retrieved from National Library of Medicine, National Center for Biotechnology Information: https://pubmed.ncbi.nlm.nih.gov/12950586/
Silvia Comunian, D. D. (2020, June 22). Air Pollution and COVID-19: The Role of Particulate Matter in the Spread and Increase of COVID-19’s Morbidity and Mortality. Retrieved from US. National Library of Medicine, National Intstitute of Health: https://www.ncbi.nlm.nih.gov/pmc/articles/PMC7345938/
Stadnytskyi (Ph.D.), V., Bax (B.A.), C. E., Bax (Ph.D.), A., & Anfinrud (Ph.D.), P. (2020, May 13). The Airborne Lifetime of Small Speech Droplets and Their Potential Importance in SARS=COV-2 Transmission | PNAS. Retrieved from Proceedings of the National Academy of Sciences of the United States of America: https://www.pnas.org/content/117/22/11875
United States Environmental Protection Agency. (2020, October). Indoor Air Quality | EPA’s Report on the Environment (ROE) | US EPA . Retrieved from United States Environmental Protection Agency: https://www.epa.gov/report-environment/indoor-air-quality
Wölfel R, C. V. (2020, April 1). Virological Assesment of Hospitilized Patients with COVID-2019-PubMed. Retrieved from National Library of Medicine, National Center for Biotechnology Information: https://pubmed.ncbi.nlm.nih.gov/32235945/