SIMS3 Sensor Information Management Software
Overview
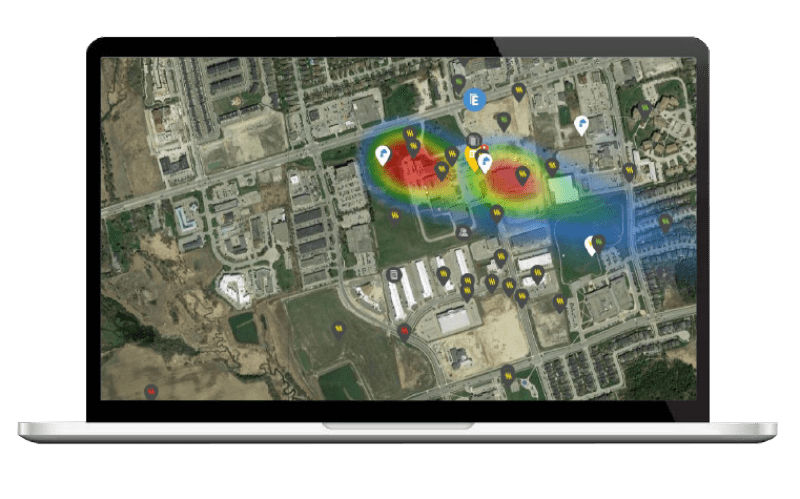
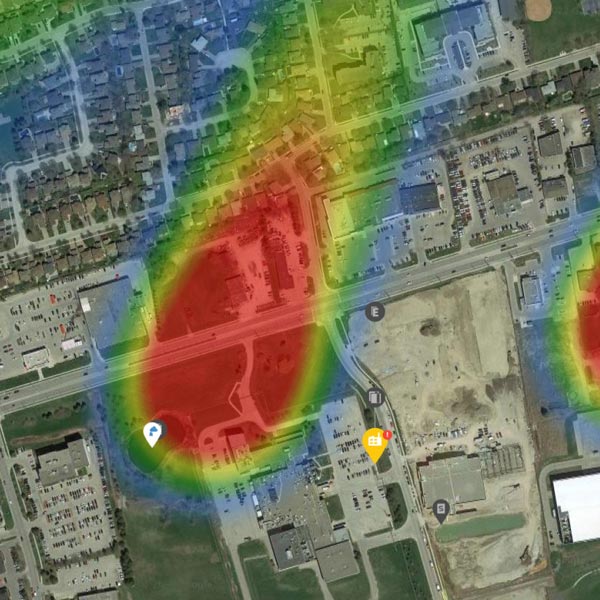
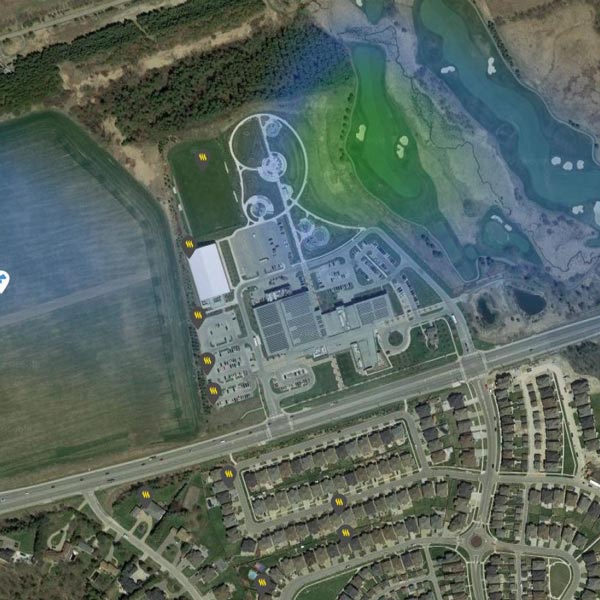
Our all-inclusive SIMS3 sensor information management software not only allows you to view and analyze historical data but also enables you to run diagnostics, make predictions, and configure various settings for your supported Scentroid device. Furthermore, it provides a complete and integrated suite for ambient air chemical analysis and odor management. Additionally, with SIMS3, you can effortlessly collect data from thousands of devices across an entire area using a unique and highly intuitive facility control system.
The Full
Experience
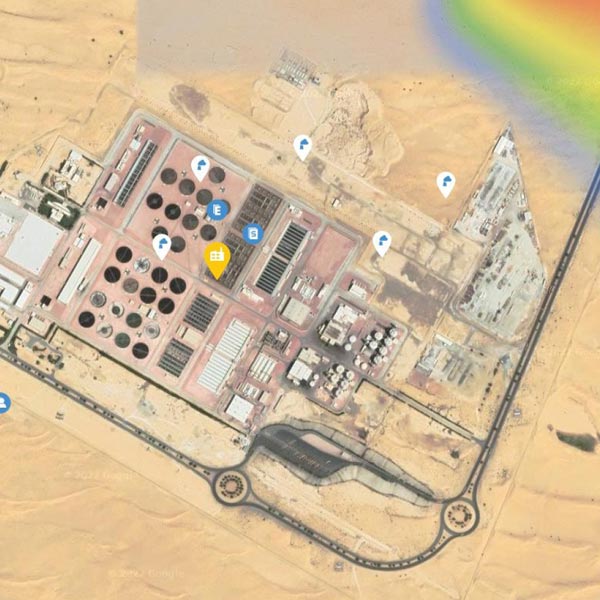
SIMS3 revolutionizes air quality monitoring and odor complaint management. The Scentroid team has worked hard to create an unforgettable user experience, carefully designing it to provide you with the tools to identify pollutant threats, manage air quality alarms, access historical data, analyze sampled areas, track plumes, handle complaints, and much more. The intuitive and aesthetic graphical interface enables anyone to run complex data analytics without needing to be an air quality expert.
SIMS3 Features
View a Few of the Many Features Within our SIMS3 Platform
Facility Organization
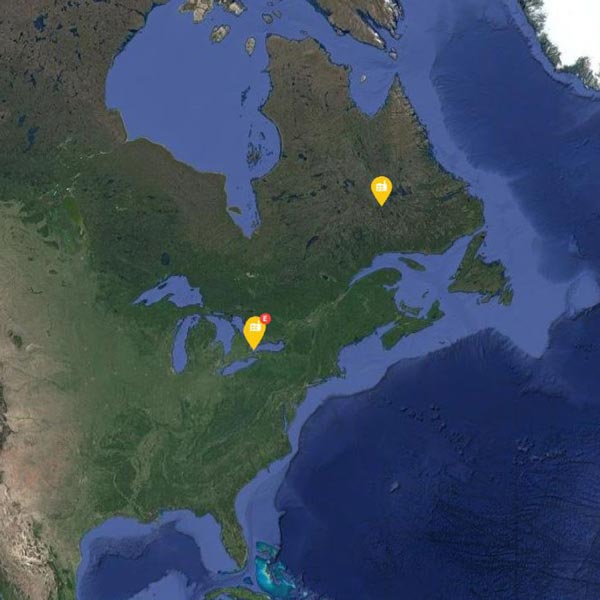
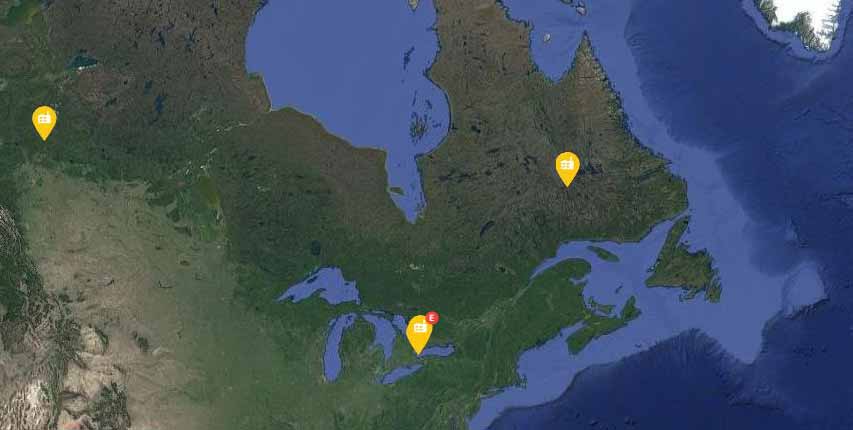
Each facility is organized separately, allowing users to see only the data from their own units. Regulators can access an overall view of all facilities within their monitoring scope.
Odor Complaint Management
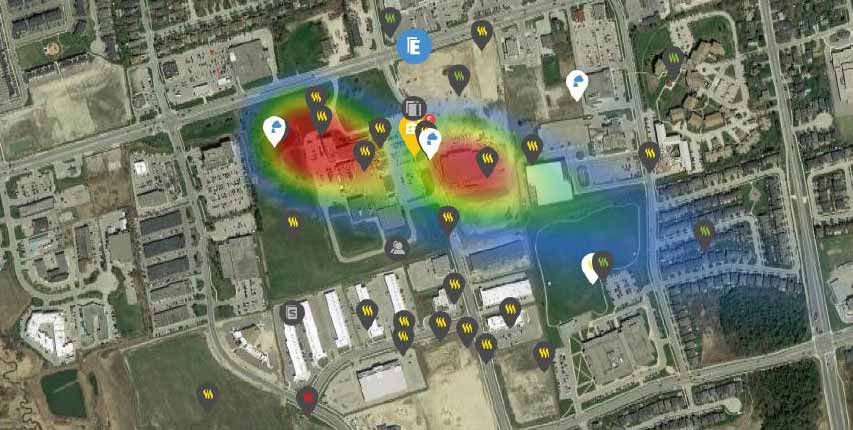
The system automatically analyzes odor complaints to determine the validity of each one against a known odor source or event. Then, it visually marks them as justified (red), not justified (green), or to be justified (yellow). For each complaint, the user receives a list of all contributing sources and events. The system also analyzes complaints with no known sources to determine their validity and identify possible locations of the unknown contributing source.
SIMS3 AI
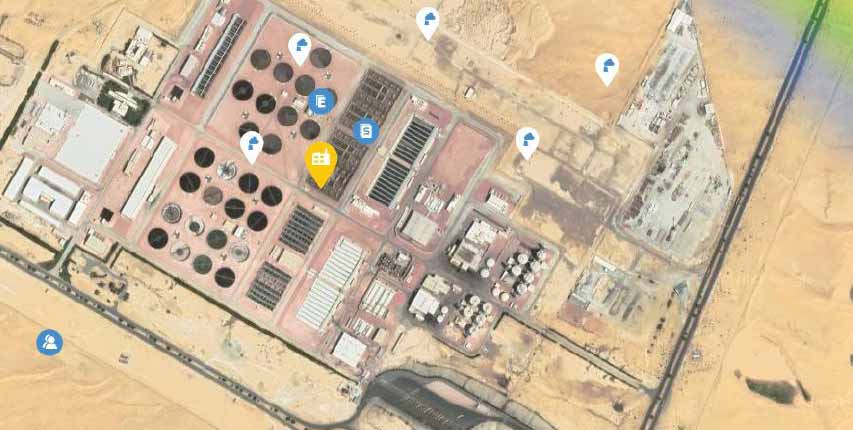
AI compares estimated odor levels from dispersion modeling to the actual measurements collected with odor monitoring equipment. It adjusts and updates the emission rates of all sources to compensate. SIMS3 uses ground level readings to conduct back trajectory analyses and identify unknown sources. Additionally, continuous pollution data and field olfactometric data, along with meteorological data, help triangulate the exact location of an odor source.
Weather and Complaint Forecasting
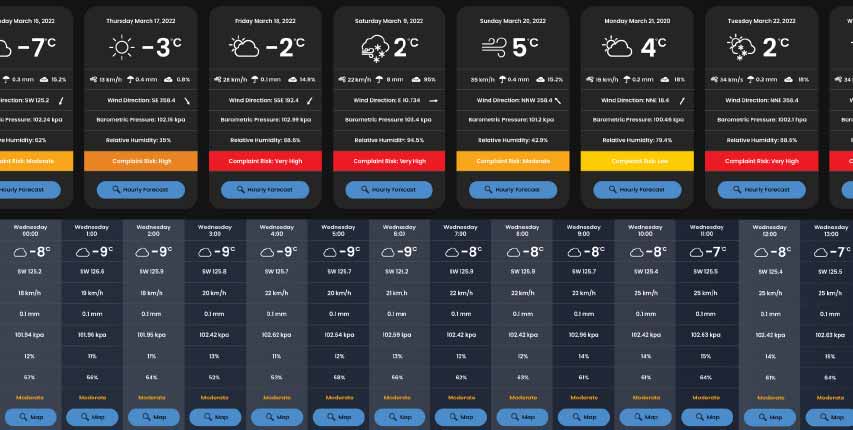
The built-in weather forecasting module allows the user to see any future weather events, determine complaint risk probability, view temperature, and more. Complaint risks are displayed underneath each individual forecast, whether daily or hourly, to assess the potential of receiving an odor complaint at that time, or for that date. Clicking on any date within the forecasted period will let the user generate a plume based on changing weather patterns, along with a complaint risk probability rating.
Event and Notification Log
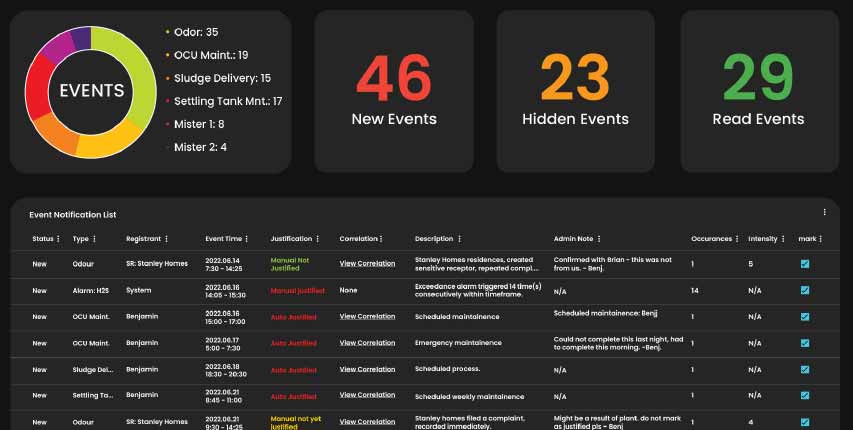
The SIMS3 Event Log contains event data, timeframe, justification, occurrences, intensity, and a brief description. At a glance, users can determine the most logged event types, determine the weekly frequency of logged events, and track the most active day, most active time, and total events registered. A series of filters allows users to quickly find a specific event, notification, event type, new or read status, event time, justification status, occurrences, intensity, and more.

Notifications
We understand that you may not always have access to your computer to view in-app notifications on sensor alarms and alerts. Should you be monitoring a potential air quality hazard, an immediate notification may be necessary. Scentroid has you covered! Our SIMS3 platform is capable of notifying you via SMS or email should any sensors report an exceedance of a pre-determined value within our alarm settings page.
Timeline Control and Navigation
A powerful component of SIMS3 is the full control of time. Users can move a Timeline Navigation Slider to investigate how a Plume evolves over a set period. Plume data readings from ambient monitors, complaints, source emissions, and all other events will all be synced with the selected time. Users can even create an animation to get a visual on how the plumes and complaints evolve, as plumes will develop and change based on weather conditions, submitted user data, and algorithmic AI developments.
Users can also move the timeline into the future and see SIMS3’s predictions for plumes, complaints, and even sensor readings within the next 2 days.
Integration of Mobile Data
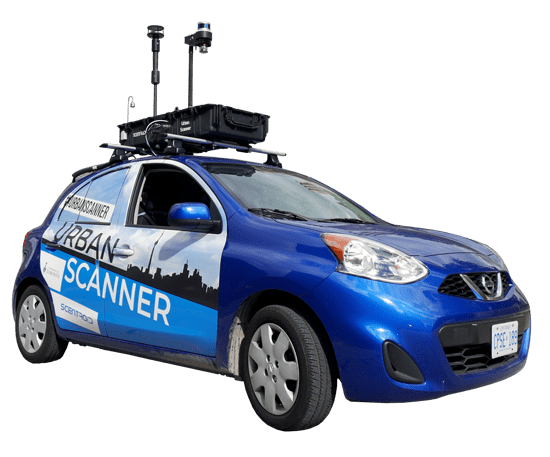
Mobile odor support units will be actively using SIMS3 to route and monitor areas of concern. Collected data from vehicles is sent to SIMS3 for automatic digestion and analysis, and further, a means for our odor experts to determine baseline impact and pinpoint additional odor sources. In the image below, the heat map module is being used to investigate a route traveled by a Scentroid Urban Scanner (US20) unit.
SIMS3 Analytics
View data in several formats including temporal view, statistical view, AQI Analysis view, and heat map.
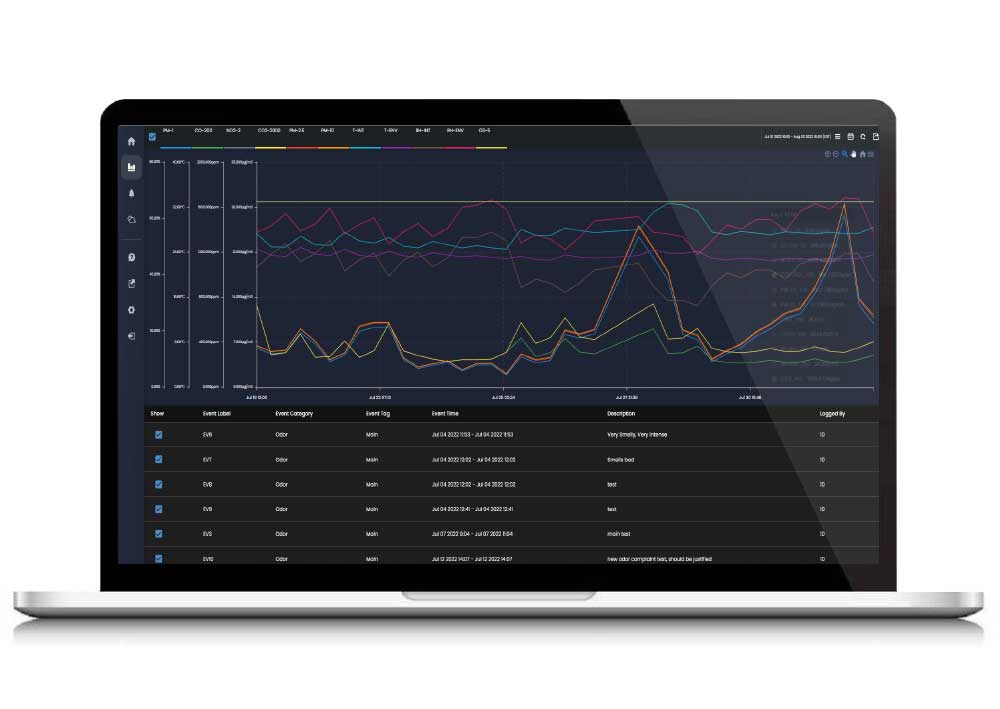
Temporal Mode
As shown here in temporal view, the user can Isolate or compare collected sensor data for any user-defined timeframe in an easy to read chart. Any event or event type that occured within the specified timeframe is also tracked.
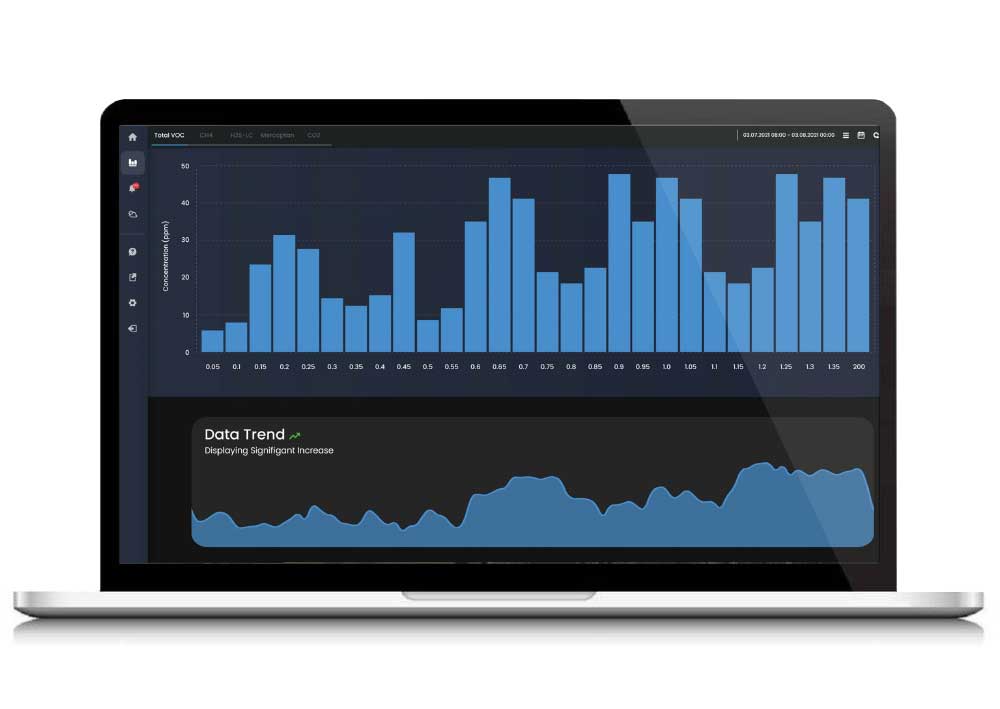
Statistical Mode
Isolate and determine individual sensor reading trends with our detailed statistical analysis view. Data is presented as percentages vs concentration for quick reference. A data trend guide displays whether your tracked chemical readings are displaying an increase or decrease.
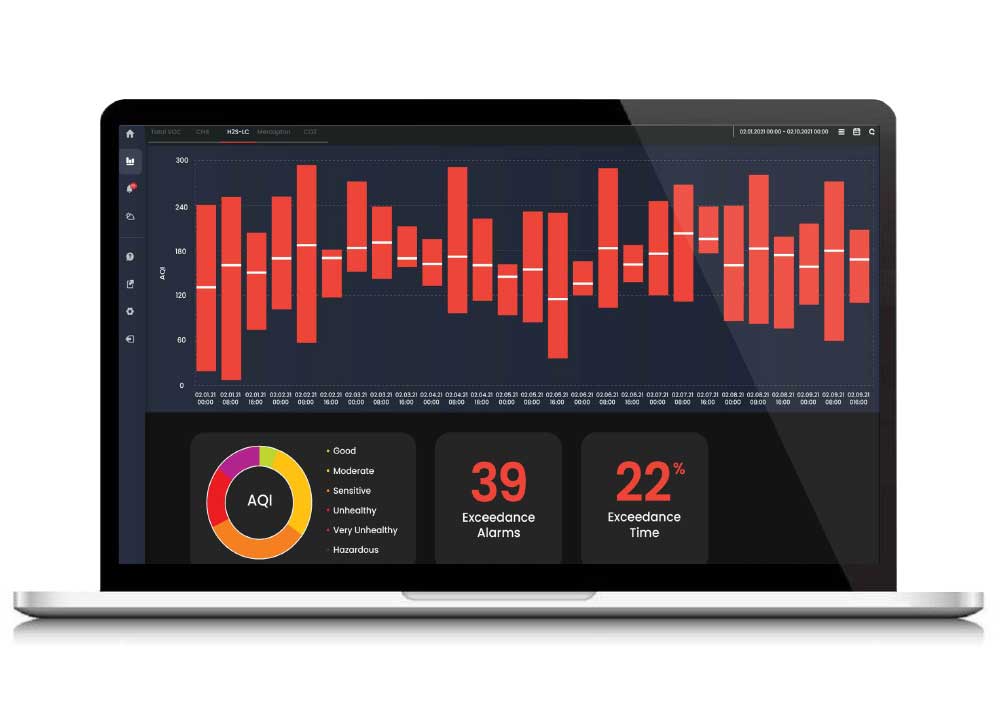
AQI Analysis
Based on established AQI Thresholds (either automatically generated or user-defined), view recorded AQI for any period of time. This module will also allow you to view how many times AQI exceeded these thresholds, and for how long (percentage).
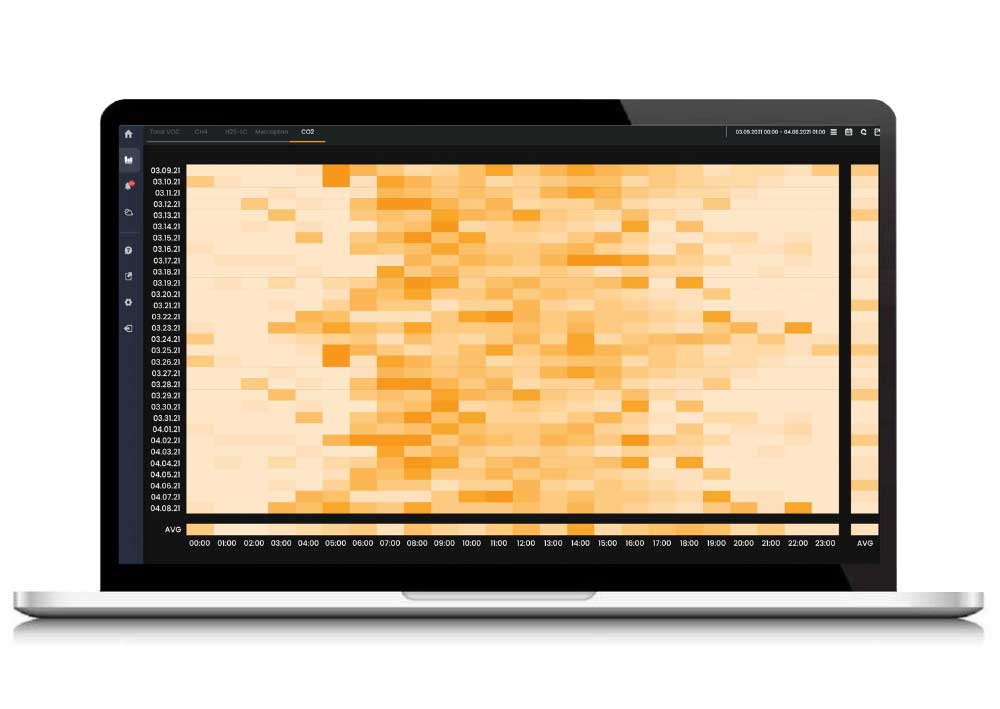
Heat Map
View each individual sensor’s heat map within a user-defined period. Concentration is presented in this format to assist the user with visually defining patterns and trends. Heat map data is presented as date vs. time.
Event Analytics
Take your analytic capabilities even further by analyzing your recorded events, event types, and overall event activity. In this module, you will be able to determine your most triggered event type and the days with the highest recorded activity.
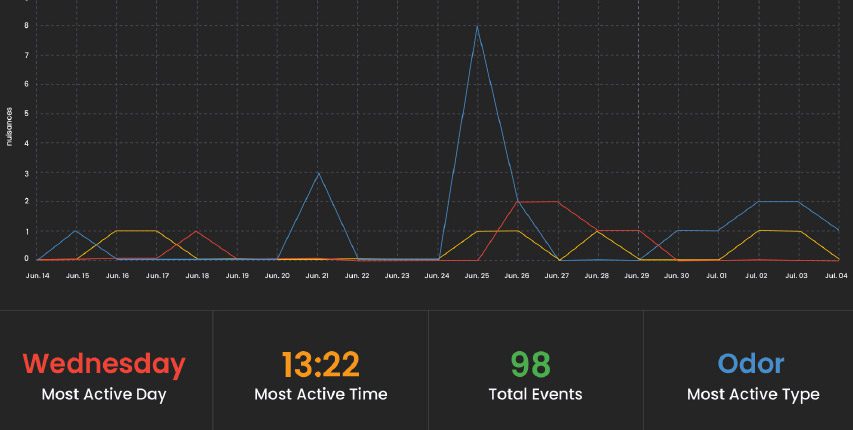
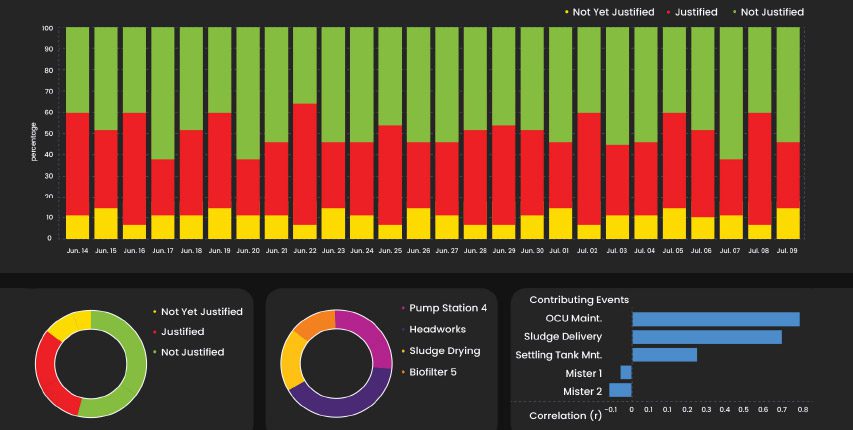
Odor Complaint Analytics
This module allows you to easily determine the justification analytics of all recorded odor events. View which days have had the highest justified or not justified events, view the correlation matrix with contributing events, and see which processes may have a connection to all recorded odor complaints.
Export Reports
The SIMS3 reporting module provides you with the tools you need to make informed decisions regarding your monitoring projects. At the click of a button, this document generates averages as well as thorough individual sensor reports. Users can schedule weekly, monthly, or annual reports emailed directly to them once generated!
Robust User Settings
A powerful user settings component allows you to customize the entire platform to better represent your facility's needs
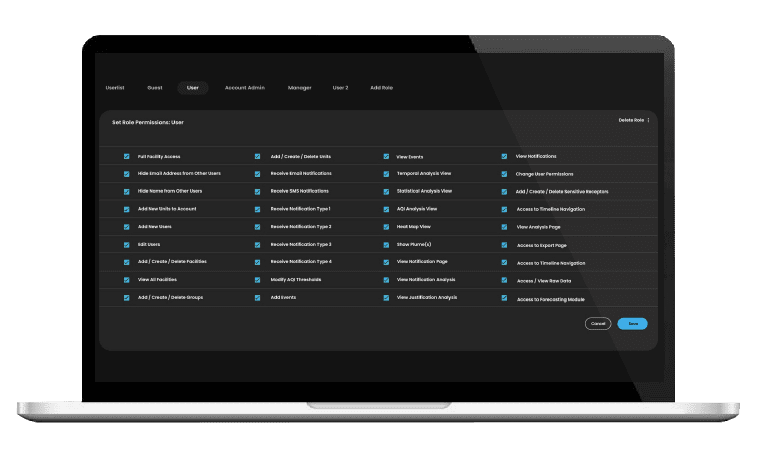
Settings: Overview
The Settings module allows a user to change individual user permissions, access privileges, user varieties, notification settings and more all in one convenient window. Users can also create new user types, calibrate their devices, establish new alarms, modify existing alarm trigger rules, and more.
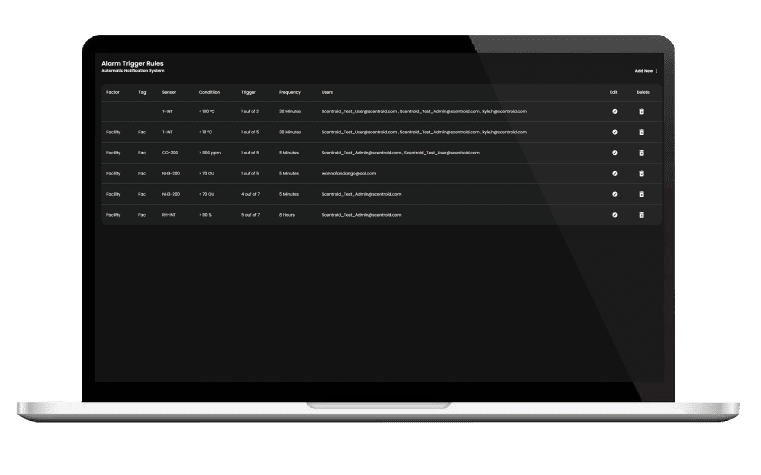
Alarms
Our Alarm center allows you to quickly view your instrument’s alarms through a clean and organized interface. Here, you can access your device, look up a specific sensor, display all of your established alarms, or create new ones with just a few mouse clicks!
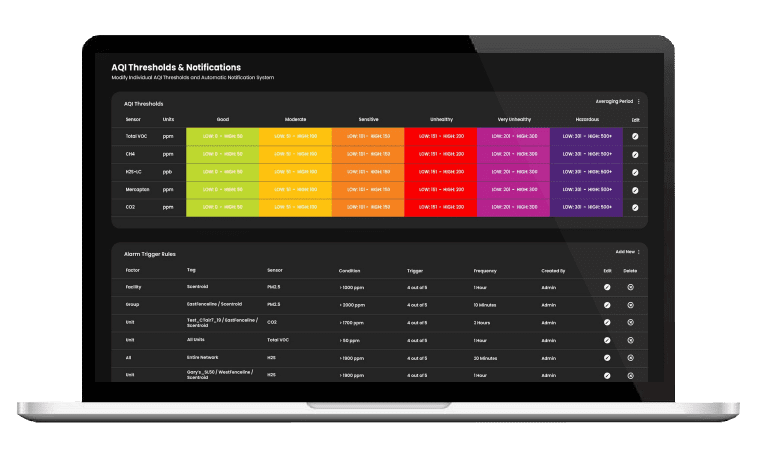
AQI Thresholds
AQI Thresholds are either automatically generated or can be user-defined through our settings page. SIMS3 users can customize individual AQI thresholds for each sensor. Should you encounter an exceedance, alarms can be set and configured for individual units, groups, or entire device networks.
SIMS3 Features
Base Version
The maximum allowed users within SIMS3. This includes the Admin. Account
How long Scentroid will store the data collected within SIMS3. This includes any data sent from your equipment to our Scentroid SIMS3 cloud server.
Graphing of Multiple Sensors for each piece of equipment. For instance, one Scentroid device may have several sensors that require individual tracking.
Receive notifications and alarms when Scentroid device experiences errors – for instance, overheating, memory card issues, communication errors, and more.
Obtain the latest firmware upgrades live via the Scentroid SIMS3 Cloud.
Add a new facility to be independently tracked within the SIMS3 platform.
Build an entire network within SIMS3 designed for your AQSafe focusing on indoor air quality monitoring.
Pro Version
The maximum allowed users within SIMS3. This includes the Administrator’s account
How long Scentroid will store the data collected within SIMS3. This includes any data sent from your equipment to our Scentroid SIMS3 cloud server.
Graphing of Multiple Sensors for each piece of equipment. For instance, one Scentroid device may have several sensors that require individual tracking.
Receive notifications and alarms when Scentroid device experiences errors – for instance, overheating, memory card issues, communication errors, and more.
Obtain the latest firmware upgrades live via the Scentroid SIMS3 Cloud.
Add a new facility to be independently tracked within the SIMS3 platform.
Build an entire network within SIMS3 designed for your AQSafe focusing on indoor air quality monitoring.
Setup and configure alarms and alarm frequency should any chemical exceedance occur beyond an established threshold. Alarms are sent via SMS and email.
Compare and contrast sensors across several pieces of equipment and view data analytics for them individually or comparatively.
Automatically detects, classifies, and organizes registered events.
Allows the connection between two or more applications, via their APIs, which lets those systems exchange data.
SIMS3 features a built-in calibration suite to assist you with calibrating your sensors and equipment.
Enables access to the weather forecasting module. This module contains all relevant weather data for your facility, and allows you to view forecasted days and determine complaint risks on those days.
Pro + OMS Version
The maximum allowed users within SIMS3. This includes the Administrator’s account
How long Scentroid will store the data collected within SIMS3. This includes any data sent from your equipment to our Scentroid SIMS3 cloud server.
Graphing of Multiple Sensors for each piece of equipment. For instance, one Scentroid device may have several sensors that require individual tracking.
Receive notifications and alarms when Scentroid device experiences errors – for instance, overheating, memory card issues, communication errors, and more.
Obtain the latest firmware upgrades live via the Scentroid SIMS3 Cloud.
Add a new facility to be independently tracked within the SIMS3 platform.
Build an entire network within SIMS3 designed for your AQSafe focusing on indoor air quality monitoring.
Setup and configure alarms and alarm frequency should any chemical exceedance occur beyond an established threshold. Alarms are sent via SMS and email.
Compare and contrast sensors across several pieces of equipment and view data analytics for them individually or comparatively.
Automatically detects, classifies, and organizes registered events.
Allows the connection between two or more applications, via their APIs, which lets those systems exchange data.
SIMS3 features a built-in calibration suite to assist you with calibrating your sensors and equipment.
Enables access to the weather forecasting module. This module contains all relevant weather data for your facility, and allows you to view forecasted days and determine complaint risks on those days.
Stores, classifies, maps, and determines justification for all received odor complaints. Complaints will be visually classified as justified, not justified, and to be justified.
Enables the creation of chemical/odor plumes, and the visual tracking of them on the map. Plumes evolve/change every 10 minutes based on weather conditions and more.
A dedicated AI system determines the chance of receiving odor complaints near your facility.
Allows the creation of formula-based sensors
Triangulates the location of sources through readings presented from active Scentroid equipment.
Determines odor concentration based on readings presented by Scentroid devices
Allows users to flow through time and determine facility changes, plume evolution, complaint tracking and more using map view.
Tag, track, and manage all known sensitive receptors. Users can even view the potential complaint risk at sensitive receptor locations.
Reporting and Analytics
Base Version
Exports all collected Sensor data to a universal excel spreadsheet
In the temporal view, the user can isolate or compare collected sensor data for any user-defined timeframe in an easy-to-read chart. Any event or event type that occurred within the specified timeframe is also tracked.
Isolate and determine individual sensor reading trends with our detailed statistical analysis view. Data is presented as percentages vs concentration for quick reference, along with a data trend guide.
Pro Version
Exports all collected Sensor data to a universal excel spreadsheet
In the temporal view, the user can isolate or compare collected sensor data for any user-defined timeframe in an easy-to-read chart. Any event or event type that occurred within the specified timeframe is also tracked.
Isolate and determine individual sensor reading trends with our detailed statistical analysis view. Data is presented as percentages vs concentration for quick reference, along with a data trend guide.
Automatically generates sensor reports based on user-defined intervals. Reports are sent directly to user’s email and are accessible within SIMS3.
View each individual sensor’s heat map within a user-defined period. Concentration is presented in this format to assist the user with visually defining patterns and trends.
Take your analytic capabilities even further by analyzing your recorded events, event types, and overall event activity.
This module will also allow you to view how many times AQI exceeded these thresholds, and for how long (percentage). Based on established AQI Thresholds (either automatically generated or user-defined).
Pro + OMS Version
Exports all collected Sensor data to a universal excel spreadsheet
In the temporal view, the user can isolate or compare collected sensor data for any user-defined timeframe in an easy-to-read chart. Any event or event type that occurred within the specified timeframe is also tracked.
Isolate and determine individual sensor reading trends with our detailed statistical analysis view. Data is presented as percentages vs concentration for quick reference, along with a data trend guide.
Automatically generates sensor reports based on user-defined intervals. Reports are sent directly to user’s email and are accessible within SIMS3.
View each individual sensor’s heat map within a user-defined period. Concentration is presented in this format to assist the user with visually defining patterns and trends.
Take your analytic capabilities even further by analyzing your recorded events, event types, and overall event activity.
This module will also allow you to view how many times AQI exceeded these thresholds, and for how long (percentage). Based on established AQI Thresholds (either automatically generated or user-defined).
Our Scentroid team is capable of providing you with more information on SIMS3, including tutorials, documentation, and more. Click the button below to speak to a SIMS3 consultant today!


