About
OdorMap
Odor pollution, while often invisible, can impact the quality of life, health and environmental sustainability. With urbanization and industrial growth, managing and resolving odour complaints is becoming increasingly critical. To address this issue, Scentroid, a world leader in air quality and odor monitoring solutions, has developed OdorMap, a mobile app that tracks, validates, and resolves odor complaints in real time.
OdorMap allows users to report odor incidents and integrates powerful features like geo-tagging and complaint verification through meteorological and industrial data analysis. This app fosters collaboration between the public, industries, and environmental regulators, empowering all stakeholders to monitor, validate, and resolve odor complaints with scientific accuracy and accountability.
How it works
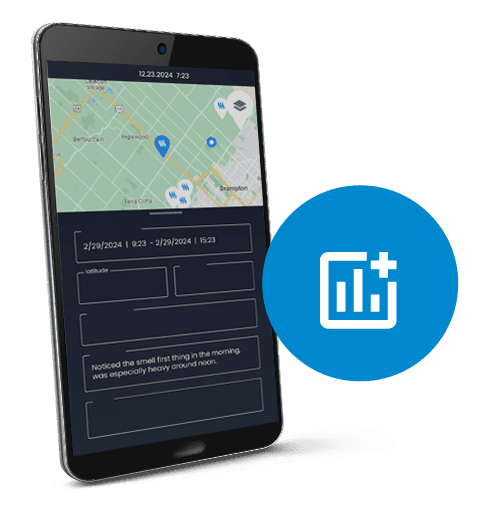
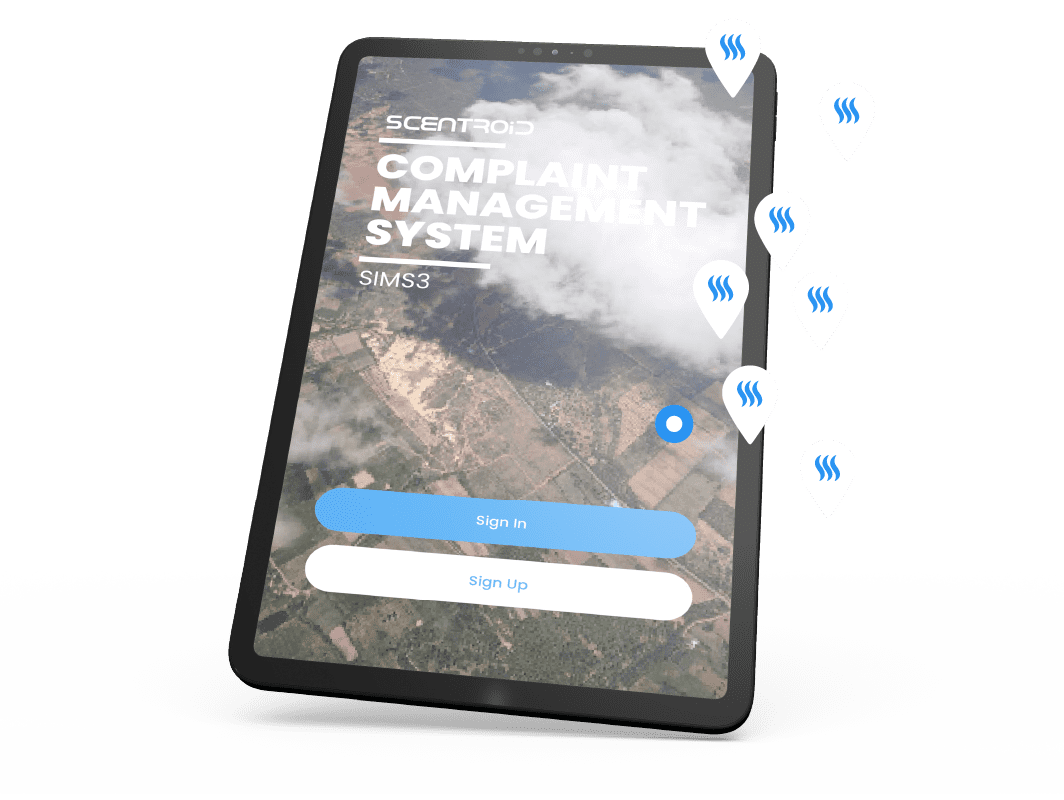
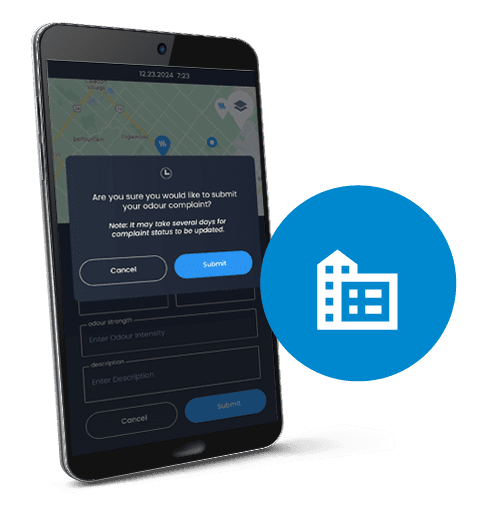
OdorMap allows users to anonymously and easily report odour complaints through a simple and intuitive interface. Specifically, users can describe the odour, rate its intensity, and specify the time and location of the incident. Furthermore, we handle your complaints with care and ensure that they are submitted anonymously. In addition, we only collect your email address to inform you of updates regarding your complaint.
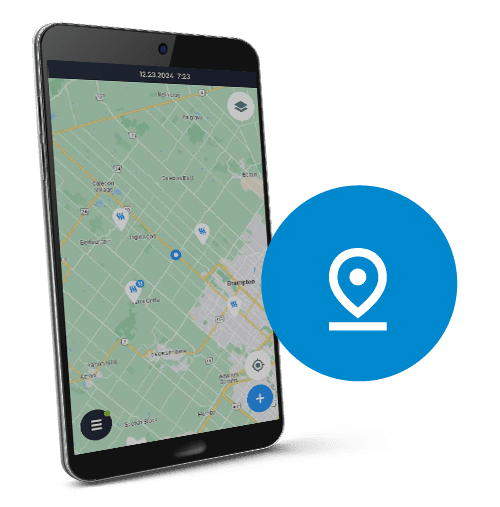
Each report is geo-tagged, thereby pinpointing the exact location of the incident. Additionally, an interactive map displays your submitted data, allowing you to quickly access your reports and see any updates. Moreover, this functionality will assist the Scentroid team in determining patterns and trends as they become identifiable. Furthermore, it provides valuable insight into recurring issues or potentially new odour sources, ultimately enhancing the overall understanding of odour-related concerns.
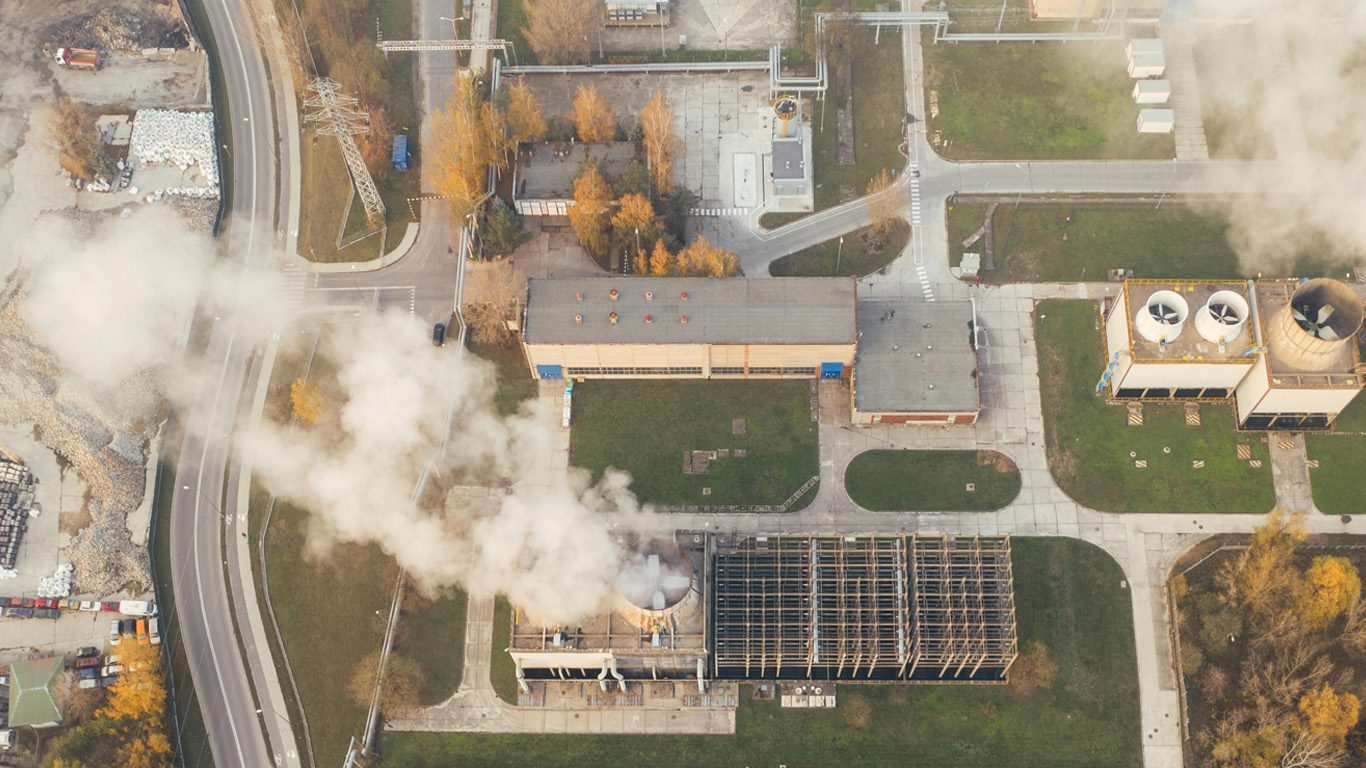
OdorMap integrates with local industrial operations and environment monitoring data. Furthermore, by correlating odour complaints with nearby industrial activities. Such as emissions from factories, landfills, or sewage treatment plants, the app can help validate whether a reported odor is related to an operational issue. Scentroid uses this data to determine the legitimacy of complaints and links them to potential sources, aiding regulators and industries in addressing odour issues promptly.
Scentroid then performs complaint validation through real-time meteorological and emission data accordingly. This, in turn, allows the app to analyze whether an odour complaint is scientifically plausible based on environmental conditions. Moreover, by comparing the reported odour’s location and time with weather patterns and emission data from nearby sources, OdorMap not only validates complaints but also identifies probable sources with a high degree of accuracy.
Predict Odor Dispersion Patterns with SIMS3
OdorMap then utilizes Scentroid’s advanced SIMS3 modeling system to predict odour dispersion patterns. When someone reports an odour, SIMS3 generates a plume based on weather conditions and emission data from nearby sources. Furthermore, the plume model indicates whether the odour is likely to spread, enabling Scentroid to validate and pinpoint the source of the complaint while assessing the environmental impact. Additionally, we collect information from users to convey to the facility, including a description and an intensity rating, which provide a measure of impact.
Anonymized Complaint Data
Meanwhile, OdorMap provides anonymized complaint data to the appropriate industries and/or government bodies. This specifically allowing them to take swift action to mitigate the problem. Our Scentroid SIMS3 platform will then provide robust data analytics and reporting tools to these industries and environmental authorities. Regulators can track odor complaint trends and identify problematic sources using our provided tools. We use the data to optimize industrial processes, further minimizing emissions and hopefully, reducing complaints over time!
Update Status Regularly
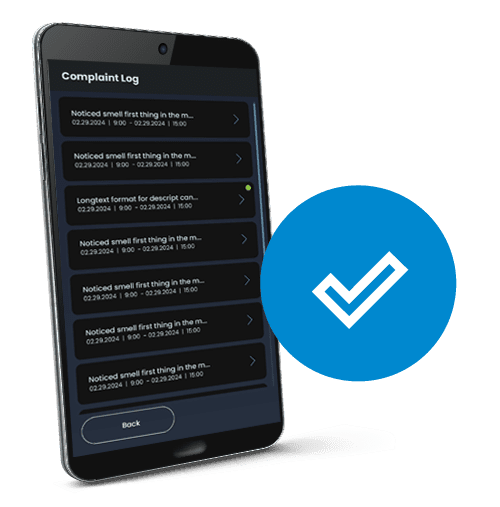
Lastly, OdorMap will provide its users with a notification if discover complaint source , and forward any updates directly from the facility. The app also update complaint status regularly, as necessary.
Between Residents, Industries & Regulators
Empowers Communities
OdorMap empowers communities to actively participate in environmental monitoring. The app’s user-friendly complaint submission system allows residents to report odour issues with ease, while the public map feature fosters transparency and accountability.
By providing real-time updates and alerts, OdorMap informs and engages communities in the resolution process, helping to build trust between residents, industries, and regulators.
Who We Are
Scentroid
Scentroid is a global leader in developing innovative technologies for air quality and odour monitoring. We provide state-of-the-art devices and use software platforms used by municipalities, industries, and environmental agencies worldwide. Our expertise in sensor technology, environmental science, and data analytics has positioned us as pioneers in tackling environmental challenges through technology.
Scentroid’s product portfolio includes air quality monitors, portable and stationary odour monitoring systems, and advanced environmental management software like SIMS3 (Scentroid Intelligent Management System), which is designed for detailed analysis and management of odour and air quality data.
OdorMap
The latest innovation from Scentroid, leveraging our advanced expertise in environmental monitoring to deliver a comprehensive and user-friendly platform for odour complaint tracking and quick resolutions.
FAQ
OdorMap uses your device’s GPS to accurately record the location where you experience an odor. This information is crucial for identifying patterns in odor complaints and for linking complaints to potential sources nearby. Rest assured, your location data is only used for this purpose and is not shared with any third parties.
Filing an odor complaint on OdorMap is simple:
- Open the app and allow it to access your location.
- Once the app detect your location, describe the odor and its intensity.
- Submit the complaint, and our system will analyze it using nearby meteorological data and local industry information to find potential sources of the odor.
- You’ll receive status updates via email regarding your complaint.
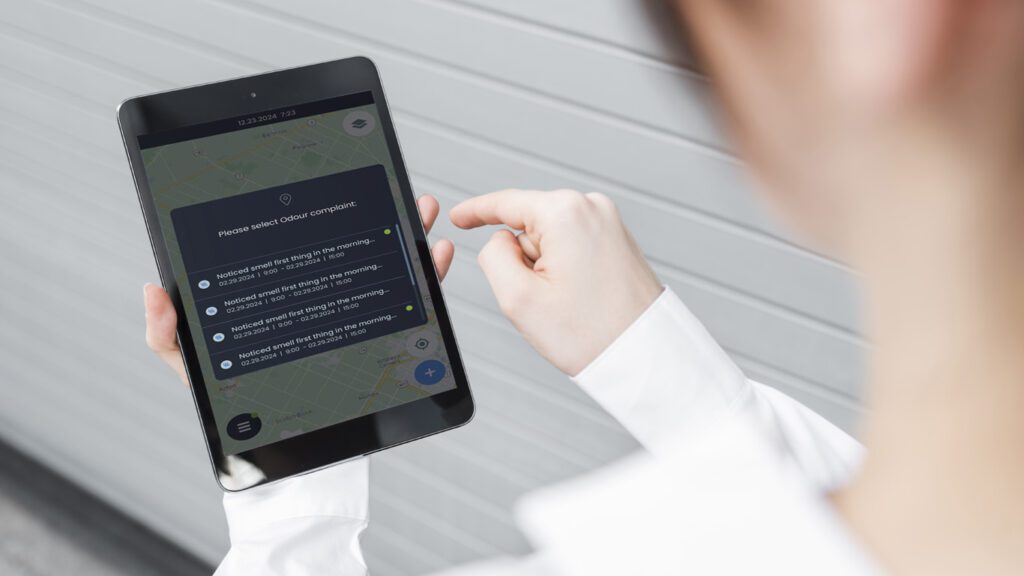
To view current odor complaints:
- Open the OdorMap app and view the map.
- Click on the map point you want to see more information about.
- Alternatively, you can click on the Complaint Log button at the bottom of the app to view a list of all the complaints you’ve filed, along with any updates on their status.
OdorMap uses your device’s GPS to accurately record the location where you experience an odor. This information is crucial for identifying patterns in odor complaints and for linking complaints to potential sources nearby. Rest assured, your location data is only used for this purpose and is not shared with any third parties.
Filing an odor complaint on OdorMap is simple:
- Open the app and allow it to access your location.
- Once the app detect your location, describe the odor and its intensity.
- Submit the complaint, and our system will analyze it using nearby meteorological data and local industry information to find potential sources of the odor.
- You’ll receive status updates via email regarding your complaint.
No, for privacy reasons, OdorMap does not reveal the identity of the facility to you, unless the facility chooses to reveal their identity. The goal is to ensure the app inform that facilities of complaints without breaching the privacy of users. You will, however, receive updates on the status of your complaint, and the facility is given the chance to respond to the issue anonymously.
Yes, after submitting a complaint, OdorMap will send you email updates regarding its status. These updates will inform you of any actions taken, such as whether the complaint has been received by a facility, but no specific details about the facility will be shared.
OdorMap uses your complaint data to help identify patterns of odor issues across different areas. While your specific complaint remains anonymous, Scentroid may use aggregate, anonymized data to encourage facilities to invest in better odor monitoring and control technologies. This helps improve air quality and reduce odor complaints over time.
In cases where the system is unable to identify a specific facility responsible for the odor, the app will still log your complaint. This data helps build a broader understanding of odor issues in the area and can contribute to future investigations. Rest assured, your feedback is still valuable and may aid in uncovering persistent odor sources over time.
No, OdorMap does not reveal other users complaints. All user’s identity is fully protected when using OdorMap. The goal is to ensure that facilities are informed of complaints without breaching the privacy of users.